
MARKET COMMENTARY
Markets kicked off the week on a strong note after a breakthrough in U.S.–China trade negotiations. Over the weekend, both countries agreed to cut reciprocal tariffs from 125% to 10%, launching a new 90-day negotiation period. Treasury Secretary Scott Bessent said it’s “implausible” tariffs fall below 10%, but the agreement has eased near-term trade tensions and boosted sentiment.
This week’s key data includes April’s Consumer Price Index (CPI) on Tuesday and Producer Price Index (PPI) and retail sales on Thursday. Both headline and core CPI are expected to rise 0.3% month-over-month. Year-over-year, headline CPI is projected to stay at 2.4%, with core at 2.8%. Inflation expectations are rising amid tariff uncertainty, and Fed officials have warned of potential price pressure. Fed Chair Jerome Powell speaks Thursday, while other Fed officials speak Wednesday. Markets now see just an 11% chance of a June rate cut, and a 45% chance in July.
On the earnings front, Cisco reports Wednesday and could provide insight into enterprise tech and AI infrastructure spending. Applied Materials reports Thursday, offering a read on semiconductor demand. Walmart also reports Thursday and is expected to comment on pricing trends and supply chain impacts from tariffs, especially as port activity slows on the West Coast.
Newton Model Insights:
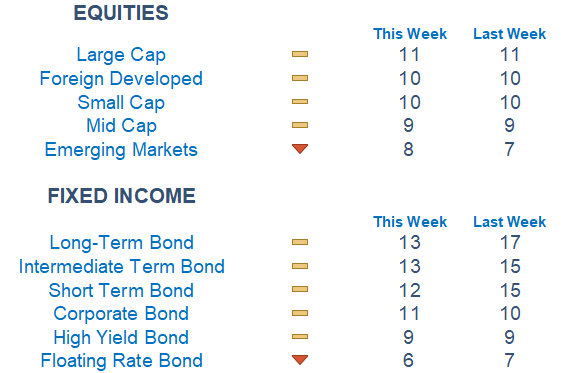
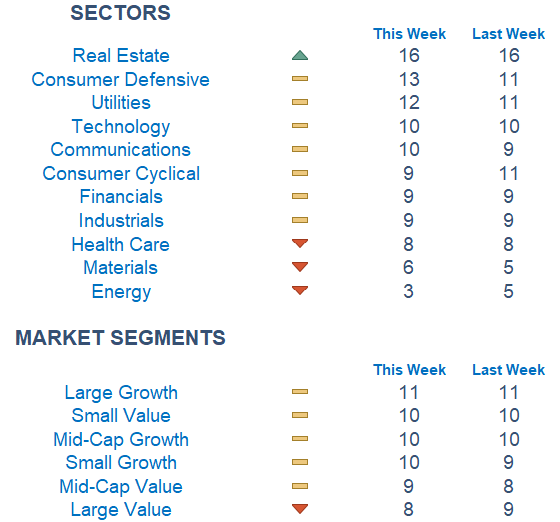
Our Newton Model continues to reflect strength in Large Caps relative to Foreign Developed and Emerging Markets. At the sector level, Real Estate and Consumer Defensive lead for a second week, although recent tariff shifts may erode this momentum. Materials and Energy remain the weakest performers. In fixed income, long-term and intermediate-term bonds maintain leadership, while Floating Rate and High Yield lag behind this week.
Economic Releases This Week
Monday: Fed Governor Kugler Speaks, Monthly US Federal Budget
Tuesday: NFIB Optimism Index, Consumer Price Index
Wednesday: Fed Governor Waller Speaks, Fed Vice Chair Jefferson Speaks
Thursday: Initial Jobless Claims, US Retail Sales, Producer Price Index, Fed Chairman Powell Speaks, Home Builder Confidence Index
Friday: Import Price Index, Housing Starts, Building Permits, Consumer Sentiment (prelim)
Stories to Start the Week
Trump Signs Executive Order Aimed at Lowering Drug Prices
AI Startup Perplexity’s Valuation Surges to $14 Billion in New Funding Round
NBC Taps Michael Jordan as NBA Contributor
Trump Says It Would Be ‘Stupid’ Not To Accept Gift Of Qatari Plane
India PM Modi Warns Pakistan Of More Strikes If There Is A ‘Terrorist Attack’
What is Newton?
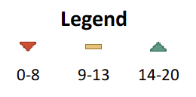
Our Newton model attempts to determine the highest probability of future price direction by using advanced algorithmic and high-order mathematical techniques on the current market environment to identify trends in underlying security prices. The Newton model scores securities over multiple time periods on a scale of 0-20 with 0 being the worst and 20 being the best possible score.
Trend & level both matter. For example, a name that moves from an 18 to a 16 would signal a strong level yet slight exhaustion in the trend.
Technical trading models are mathematically driven based upon historical data and trends of domestic and foreign market trading activity, including various industry and sector trading statistics within such markets. Technical trading models, through mathematical algorithms, attempt to identify when markets are likely to increase or decrease and identify appropriate entry and exit points. The primary risk of technical trading models is that historical trends and past performance cannot predict future trends and there is no assurance that the mathematical algorithms employed are designed properly, updated with new data, and can accurately predict future market, industry and sector performance.