
This Week on Wall Street – Week of March 30th
Last week's momentary optimism following Trump's announcement to pause attacks on Iran was short-lived, leading to another[…]

Private Credit Market Update
Private credit has grown from a niche institutional asset class into one of the most widely allocated[…]

Last Week on Wall Street – March 28th, 2026
S&P 500: -2.12% DOW: -0.83% NASDAQ: -3.24% 10-YR Yield: 4.43%
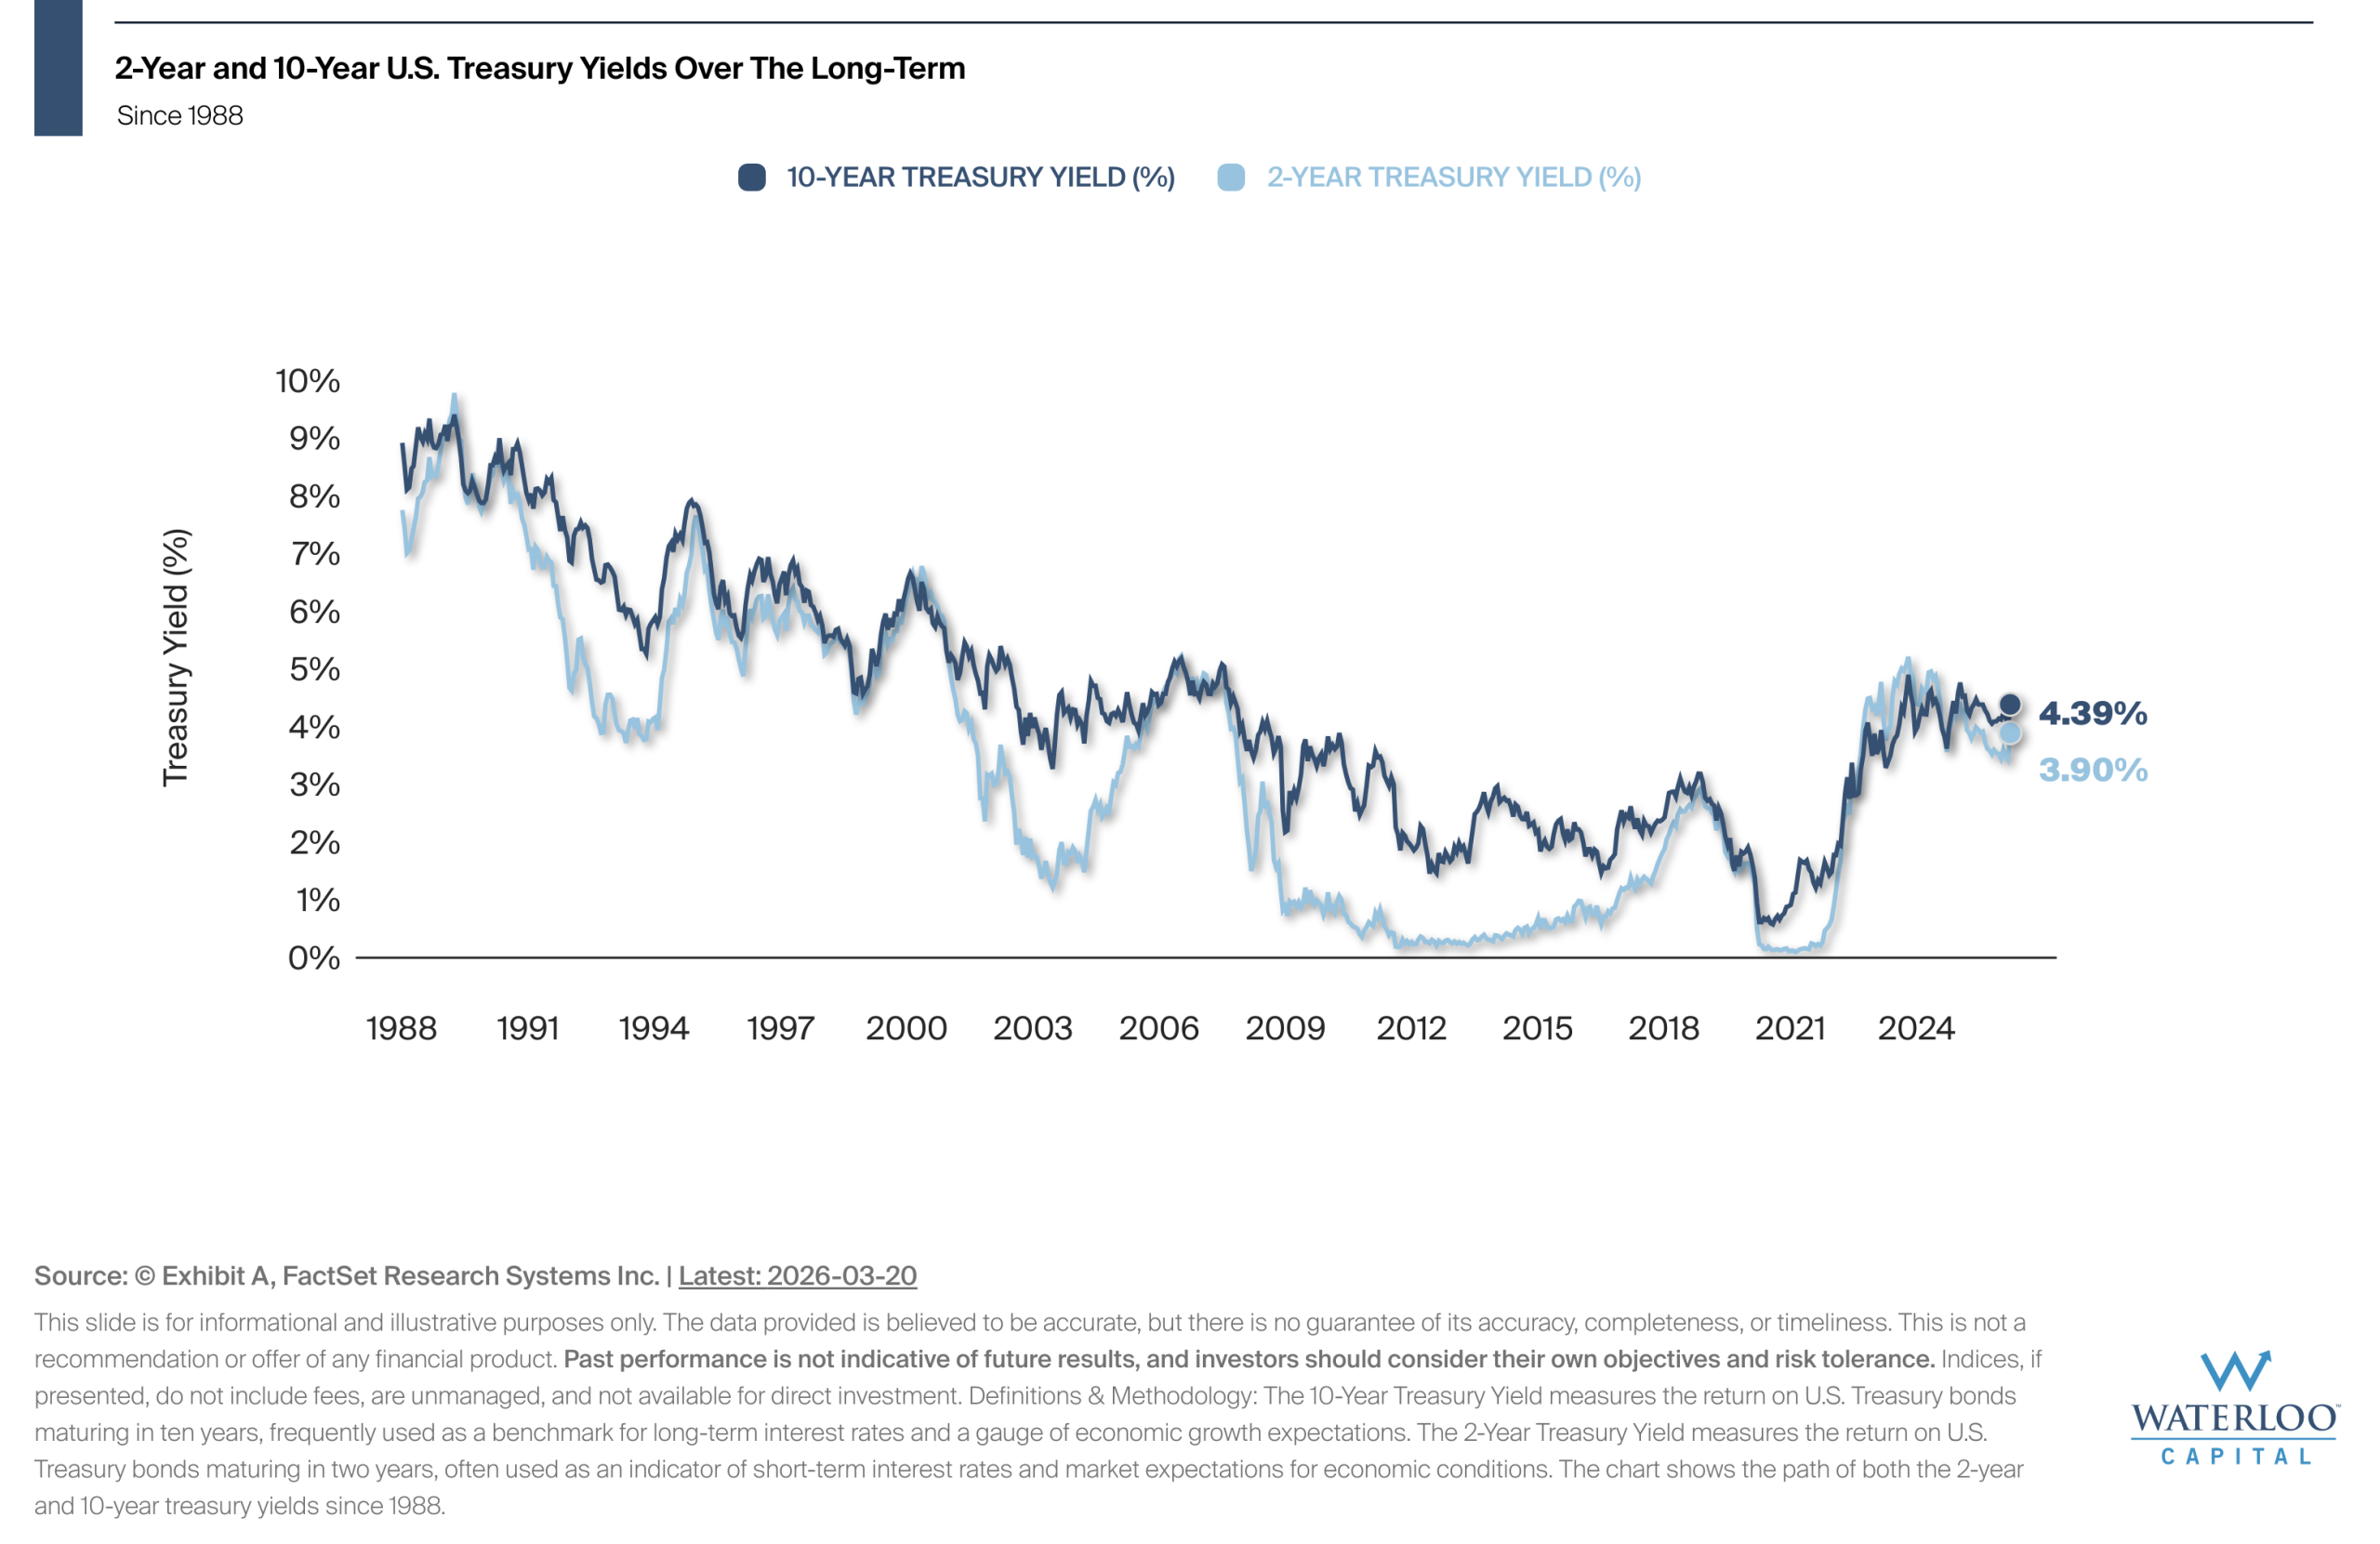
Chart Of the Week – A Long-Term View of US Treasury Yields
The 10-year Treasury yield reflects long-term borrowing costs and investor expectations about economic growth, inflation, and interest[…]
This Week on Wall Street – Week of March 23th
Markets opened the week higher as investors welcomed signs of de-escalation in the Iran conflict followed by[…]
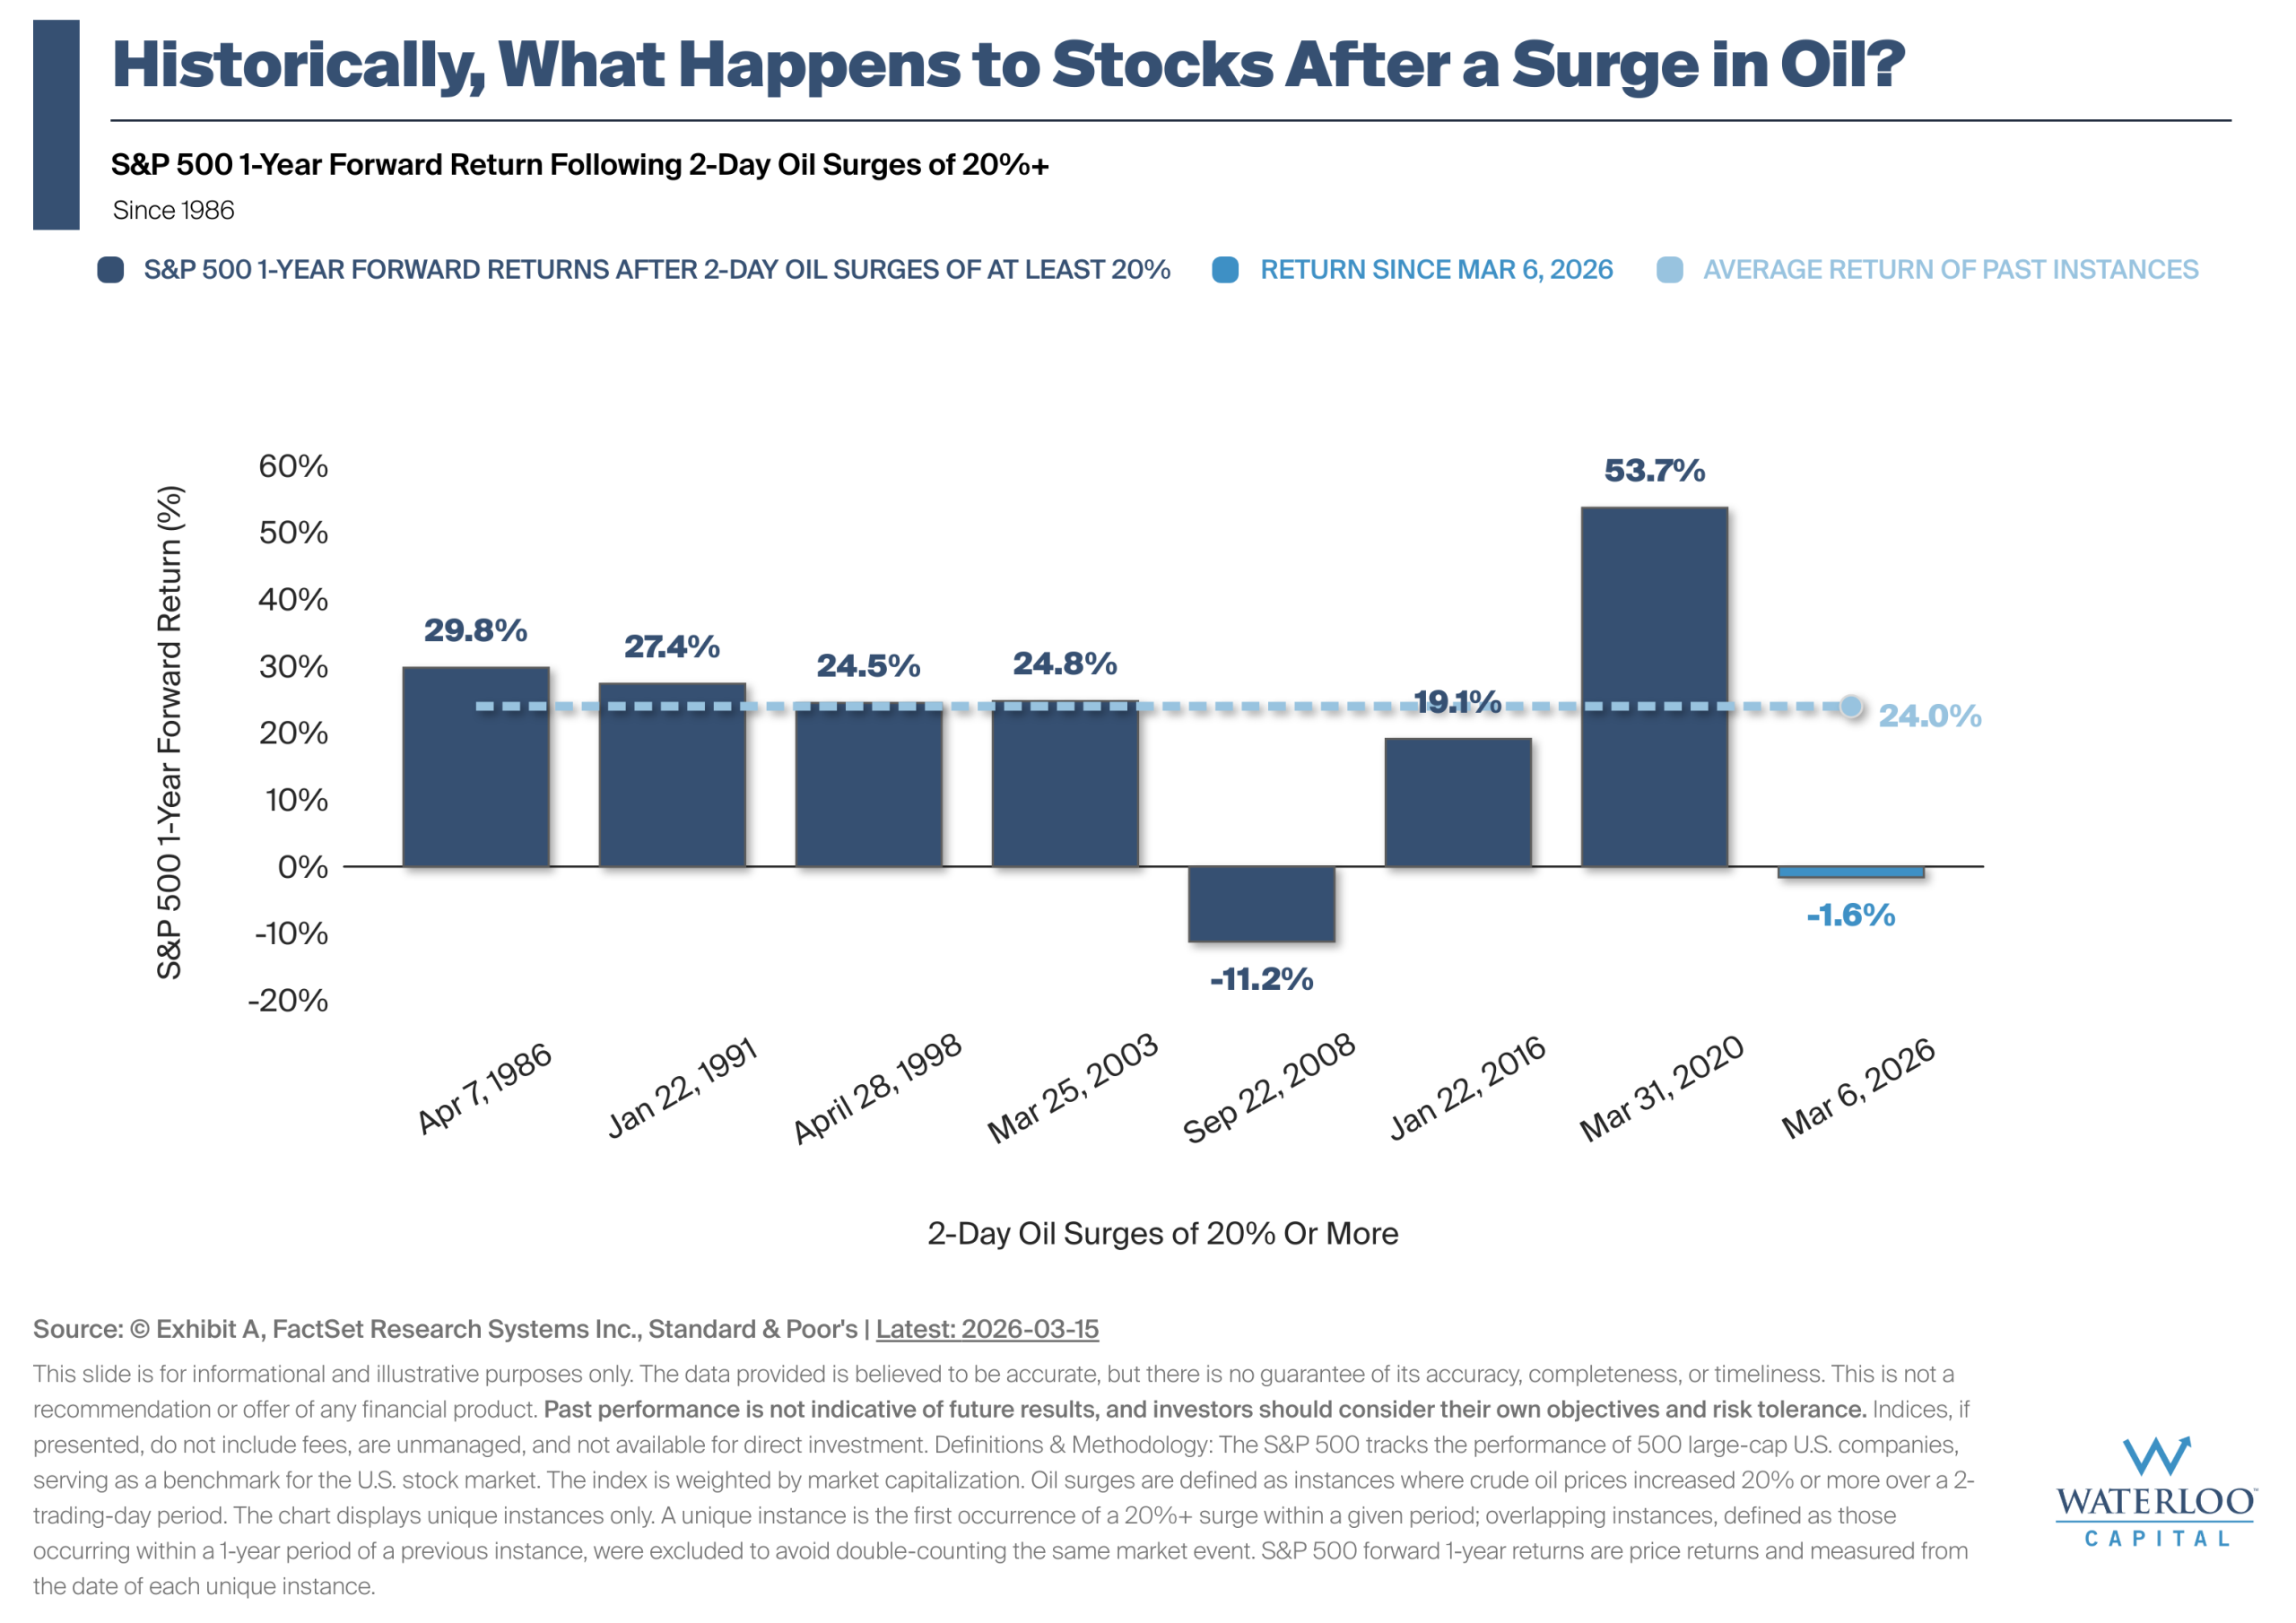
Chart Of the Week – What Happens to Stocks After a Surge in Oil?
The chart illustrates how the S&P 500 has historically performed over the following year after 2-day oil[…]
This Week on Wall Street – Week of March 16th
U.S. indexes are starting the week on a more constructive note, with stocks and bonds both finding[…]
Last Week on Wall Street – March 14th, 2026
S&P 500: -1.60% DOW: -1.99% NASDAQ: -1.26% 10-YR Yield: 4.28%
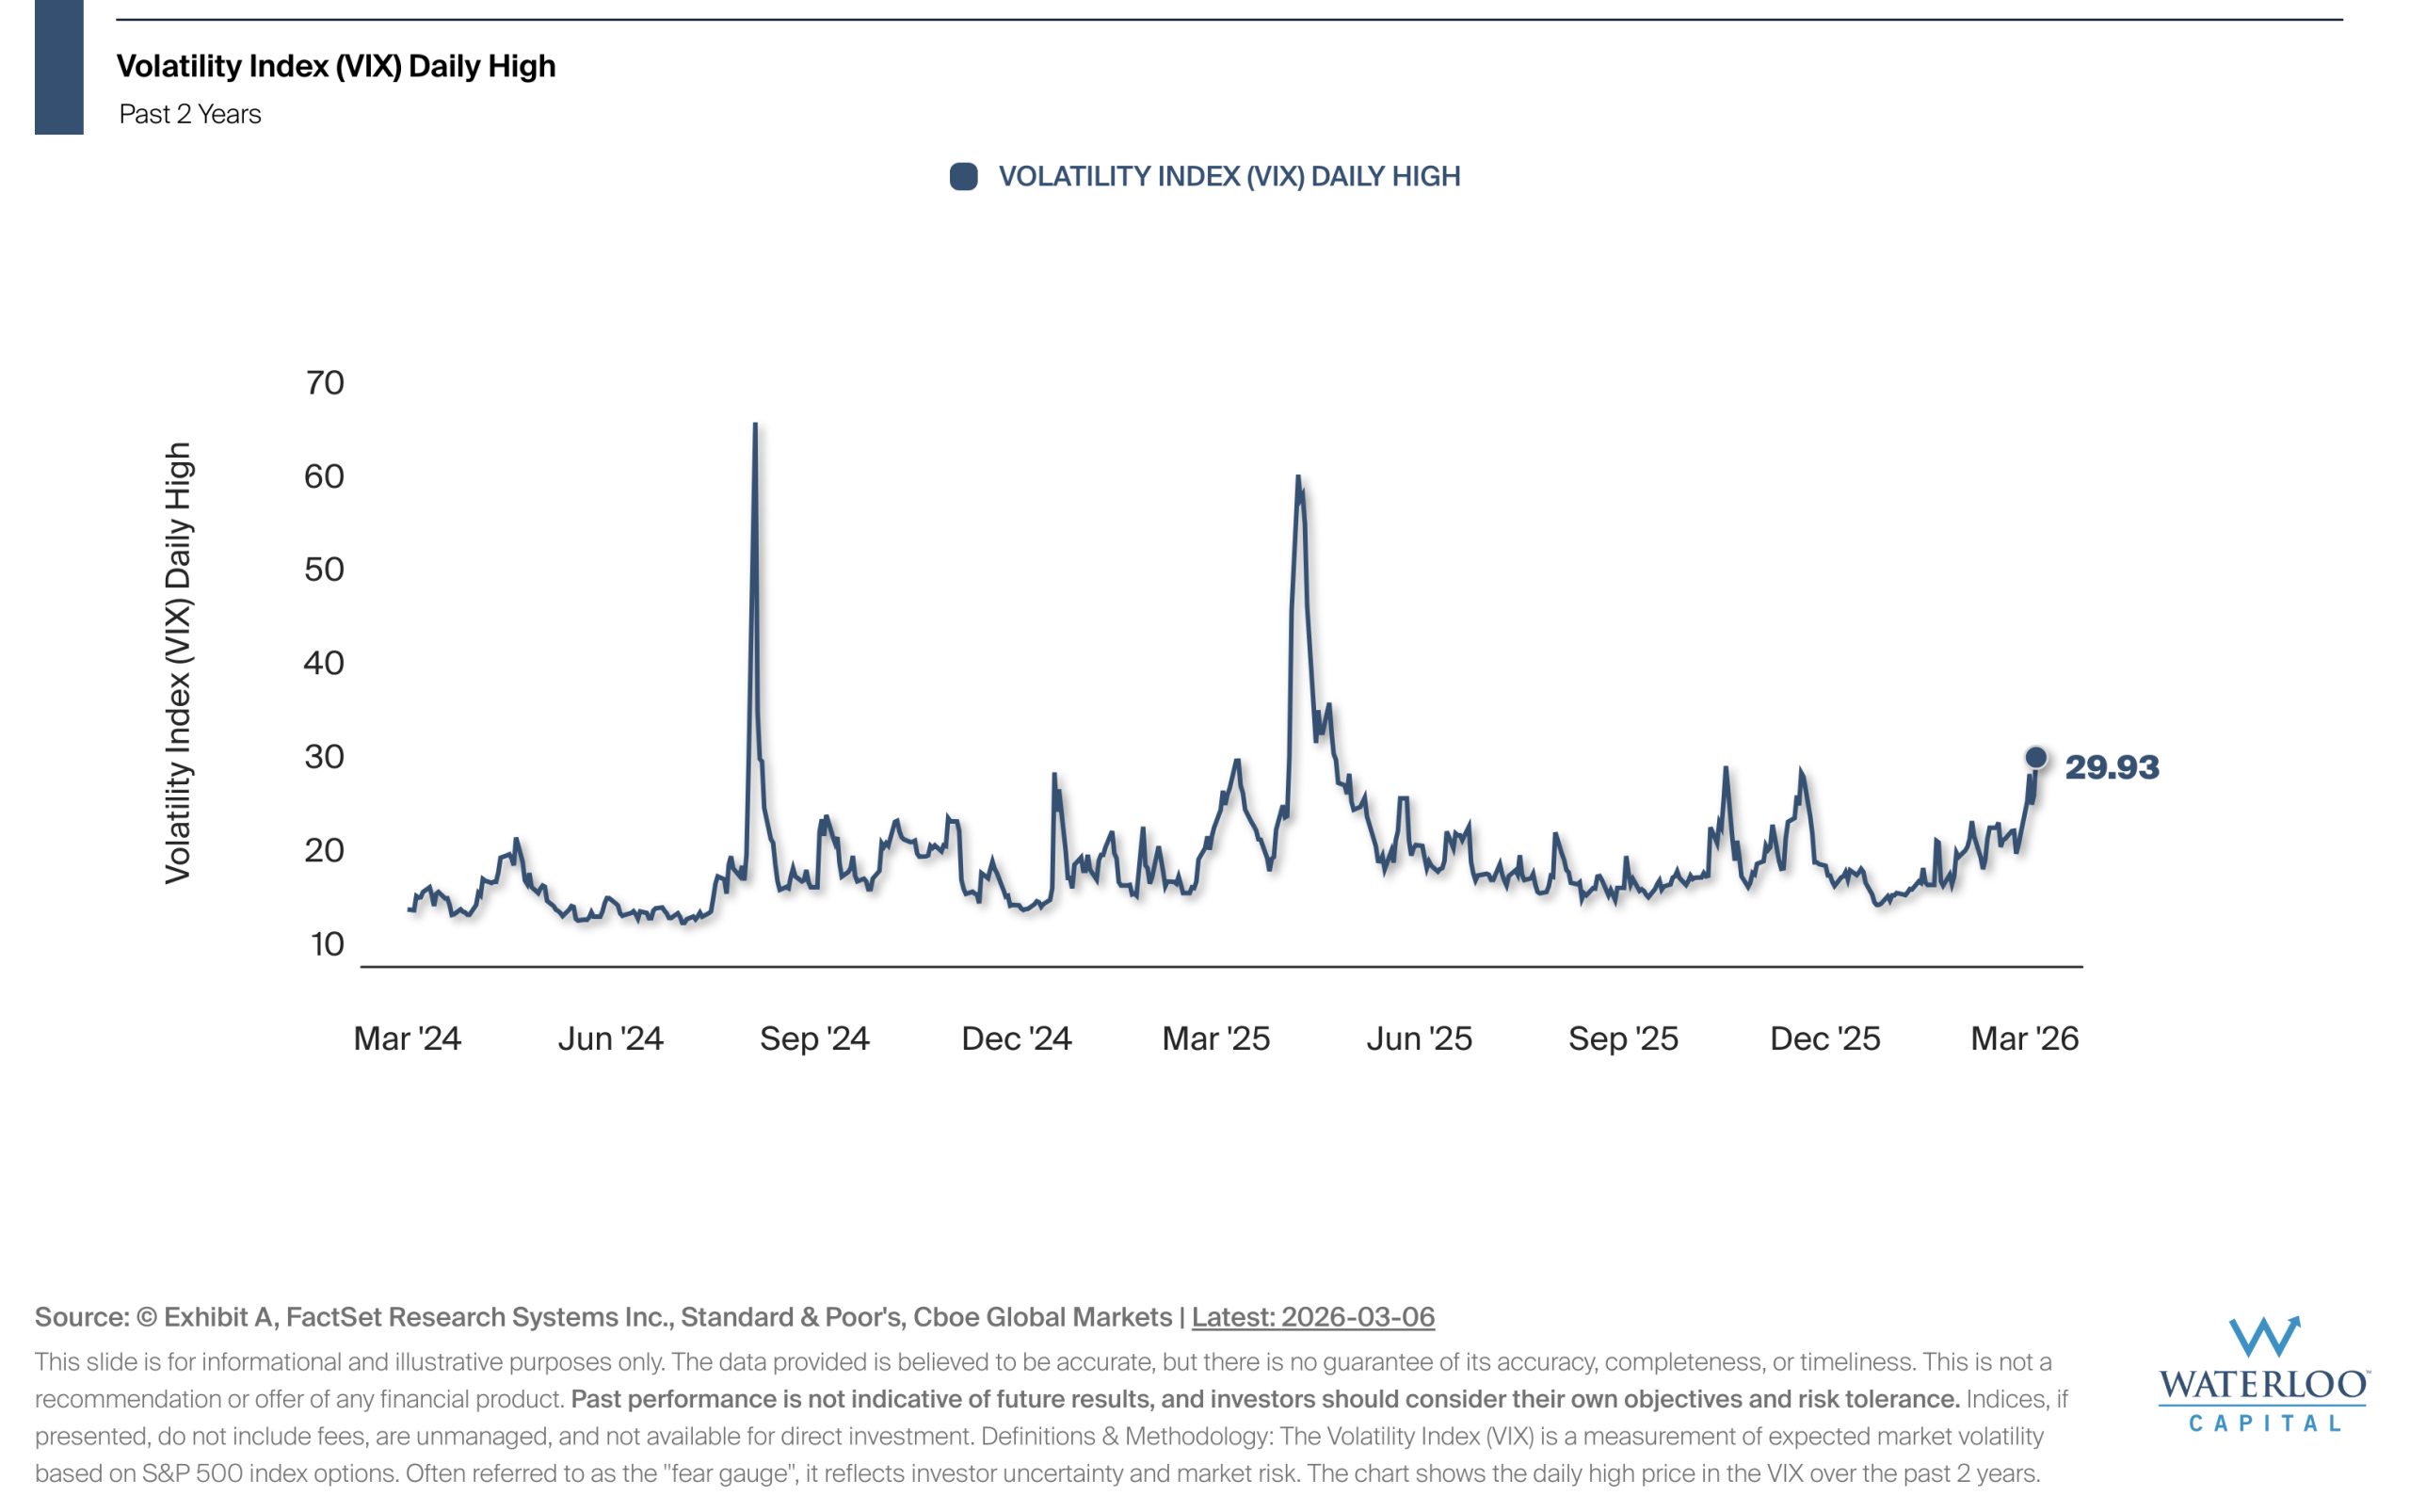
Chart Of the Week – A Short-Term View of Stock Volatility
The Volatility Index (VIX) is a widely used measure of market volatility, often referred to as the[…]
This Week on Wall Street – Week of March 9th
All major U.S. indexes are starting the week in the red after another rough stretch for stocks,[…]
Let’s Connect
©2025. Advisory services offered through Waterloo Capital, LP, An SEC Registered Investment Advisor.