
MARKET COMMENTARY
Investors returned from the long holiday weekend with a cautious tone as tariff concerns resurfaced. President Trump signed his self-described “One Big Beautiful Bill” on Independence Day, introducing sweeping tax cuts and entitlement reforms, but attention quickly shifted to looming trade tensions. The administration announced a new 25% tariff on Japan and South Korea effective August 1, along with potential 40% tariffs on Malaysia, Kazakhstan, South Africa, Myanmar, and Laos. This comes just days before the July 9 expiration of the 90-day pause on reciprocal tariffs.
Markets reacted negatively to the renewed uncertainty. The Dow fell -1.48%, the S&P 500 -1.19%, and the Nasdaq -1.27%, pulling back from last week’s record highs. That prior rally had been driven by AI momentum, easing geopolitical risk, and a stronger-than-expected June jobs report. Safe-haven assets like gold rose modestly, and the 10-year Treasury yield settled around 4.38%.
The Federal Reserve held rates steady last month at 4.25%–4.50%, with Chair Powell signaling a wait-and-see approach amid rising tariff risks. Trump continues to pressure the Fed to cut rates and is reportedly considering replacements for Powell ahead of the May 2026 end of his term. Investors will be closely watching Wednesday’s FOMC minutes for any shift in the Fed’s tone on inflation and growth.
This week’s economic calendar is relatively light, but the NFIB small business optimism index and June’s federal deficit report will be in focus, particularly as the fiscal implications of Trump’s new legislation come into view. That bill includes $4.5 trillion in tax cuts, including a three-year tax exemption on tips and overtime pay, paired with major spending reductions to Medicaid and clean energy subsidies. The national debt ceiling was also lifted by $5 trillion, deferring further debate until after the 2026 midterms.
On the corporate front, earnings season is still a few weeks away. However, major banks rallied last week after passing the Fed’s annual stress tests, which allowed them to reduce capital requirements and free up cash for lending, buybacks, and dividends. Meanwhile, clean energy stocks pulled back as the GOP-led legislation rolled back several tax credits for solar, wind, and EV projects.
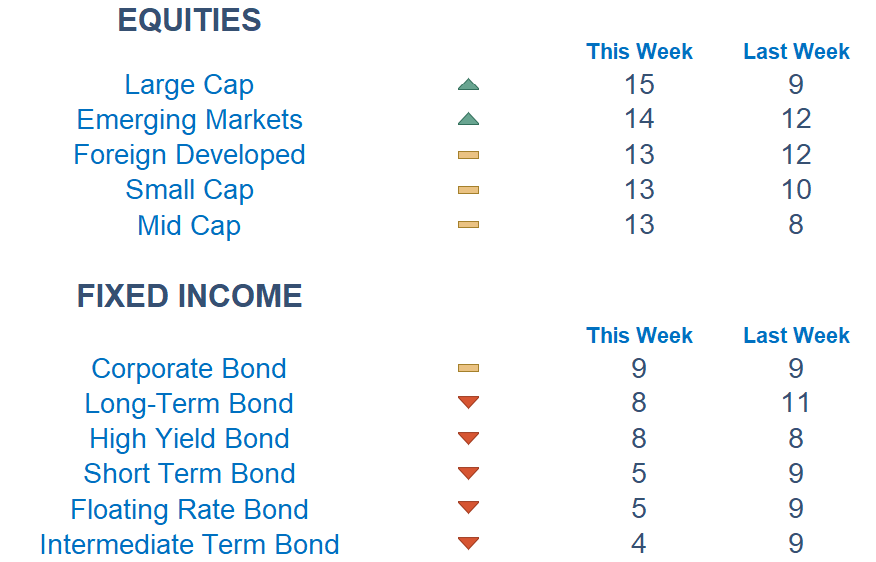
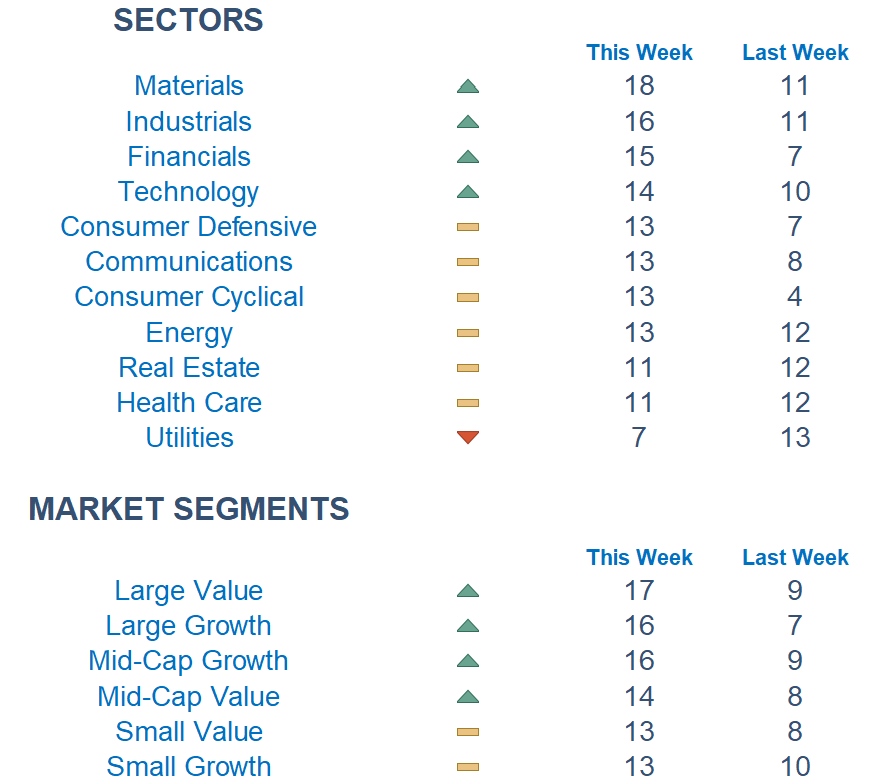
Newton Model Insights:
Our proprietary Newton Model continues to reflect domestic large-cap strength relative to foreign equities. This week, value-oriented sectors appear more attractive compared to their cyclical counterparts. Fixed income remains broadly weak, with corporate and long-term bonds still leading performance rankings, though underlying momentum appears to be fading.
Economic Releases This Week
Monday: None scheduled
Tuesday: NFIB optimism index, Consumer credit
Wednesday: U.S. tariff pause deadline, Wholesale inventories, Minutes of Fed’s May FOMC meeting
Thursday: Initial jobless claims, St. Louis Fed President speech, San Francisco Fed President speech
Friday: Monthly U.S. federal budget
Stories to Start the Week
Trump to extend key tariff deadline to August 1 as he threatens new duties of up to 40% on certain countries
Texas flooding leaves at least 95 dead or missing, including Camp Mystic counselors and campers
Trump to meet with Netanyahu at the White House as Israel and Hamas discuss ceasefire
The declining dollar faces more headwinds after posting worst first-half return in 52 years
Beyond faith: Why Dalai Lama’s reincarnation is a geopolitical tussle & not just about Tibet

Our Newton model attempts to determine the highest probability of future price direction by using advanced algorithmic and high-order mathematical techniques on the current market environment to identify trends in underlying security prices. The Newton model scores securities over multiple time periods on a scale of 0-20 with 0 being the worst and 20 being the best possible score.
Trend & level both matter. For example, a name that moves from an 18 to a 16 would signal a strong level yet slight exhaustion in the trend.
Technical trading models are mathematically driven based upon historical data and trends of domestic and foreign market trading activity, including various industry and sector trading statistics within such markets. Technical trading models, through mathematical algorithms, attempt to identify when markets are likely to increase or decrease and identify appropriate entry and exit points. The primary risk of technical trading models is that historical trends and past performance cannot predict future trends and there is no assurance that the mathematical algorithms employed are designed properly, updated with new data, and can accurately predict future market, industry and sector performance.