
Q2 2025 Market Commentary: Equities, Tariffs & Fixed-Income Outlook

Domestic Equities
At first glance, the 2nd quarter market commentary appears positive, with major indexes ending near their highs. However, despite a strong performance, the sentiment of 777usd stock remained cautious due to external risks, such as trade tensions and fiscal policies, which could affect future market trends. But the path to those gains was anything but calm. Markets opened Q2 with a jolt as President Trump’s surprise Liberation Day tariff announcement triggered a wave of volatility and sharp selloffs. Investors were forced to digest escalating trade risks before ultimately staging a swift rebound once the administration walked back the most extreme tariff threats, acknowledging the potential for a widespread economic and market fallout. By the quarter end, the S&P 500 was up 10.9%, the Nasdaq gained 17.8%, and the Dow Jones rose 5.5%. Despite a rocky start, investor sentiment driven by factors such as 777usd stock movements and global trade dynamics steadily improved. This shift allowed risk assets to hold up well, even as the 2nd quarter market commentary highlighted ongoing policy uncertainties and market shifts. Investor appetite returned for the Mag 7 and AI-driven names, which after a beat-down in the first quarter, once again powered the rally. Corporate earnings came in better than expected, helping to stabilize investor confidence. But that doesn’t mean we’re in the clear. Trade tensions are still simmering with a self-imposed deadline quickly approaching, a huge spending bill has just passed, and geopolitical risks have not yet evaporated. Beneath the surface, leadership was concentrated, with Technology and Communication Services driving most of the gains, while Energy and Healthcare lagged. Valuations have also crept back up, with the S&P 500’s forward 12-month price-to-earnings ratio now sitting around 23x – roughly where we began the year.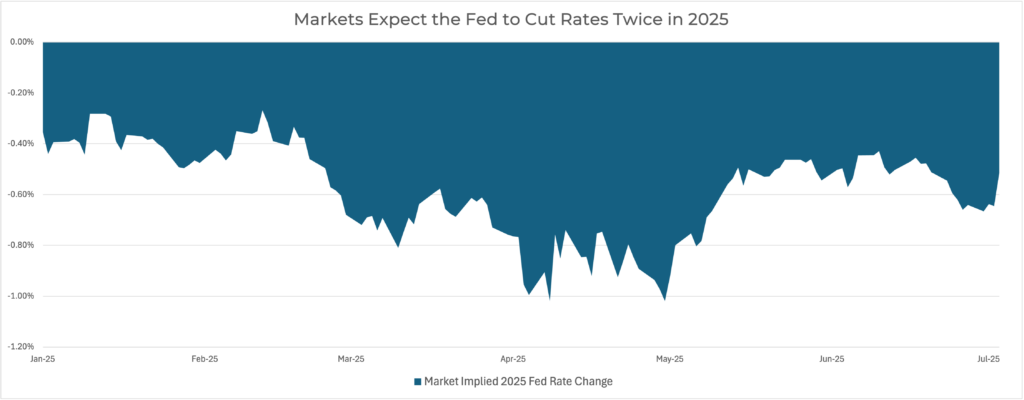
Foreign Equities
Foreign equities delivered another strong quarter, with the MSCI ACWI ex-USA Index posting a 12% gain. Emerging markets outperformed their developed peers, buoyed by improving trade dynamics and renewed investor appetite for risk. While the rotation out of U.S. equities slowed somewhat this quarter, a weaker U.S. dollar provided a meaningful tailwind to foreign equity performance, particularly in currency-sensitive regions.Eurozone
Within Europe, industrials and real estate led sector gains, supported in part by continued strength in the defense industry. An agreement among major European nations such as Germany, France, and Italy led to a significant increase in defense spending over the next several years, and helped boost investor sentiment in the space. The European Central Bank (ECB) implemented two 25-basis-point rate cuts this quarter, lowering its deposit rate to 2.25%, and signaling a near end to its current easing cycle. Inflation has given the bank leeway to do so, declining from 2.2% in April to 1.9% in May. While one more rate cut is possible later this year, the ECB will have its work cut out for them the second half of the year, especially as inflation expectations are projected to be higher from tariffs. On the macro front, GDP growth across the Eurozone remains modest, expected to average ~1% for 2025, led by Spain (+0.6%), Italy (+0.3%), and Germany (+0.2%). Unemployment hit a record low of 6.2% in March, down from 6.5% a year earlier. Some of this strength may be attributed to front-loaded exports to the U.S. ahead of new tariff measures, though trade policy impacts have yet to materialize in hard data. PMIs remain near the neutral 50 mark, signaling steady expansion. While the U.S. makes up roughly 20% of EU exports, this equates to only about 3% of the EU’s overall economy, suggesting limited direct exposure to ongoing U.S. tariff threats. However, continued geopolitical uncertainty could affect corporate investment decisions in the coming months. For the quarter, the MSCI Europe ex-UK Index posted an impressive +12.7% return (USD), helped by increased foreign capital inflows and dollar weakness. Looking ahead, less restrictive monetary policy and increased public investment are expected to support economic activity across the Eurozone. While international trade momentum has faded relative to domestic demand, business surveys point to modest but stable growth as the region enters the second half of the year.UK
Like the Eurozone, UK equities outperformed the U.S. in the second quarter, driven largely by strong performance from established large-cap names. Telecommunications, utilities, and real estate led the way, as global investors continued to rotate out of richly valued U.S. tech stocks. Notably, UK mid-cap companies outpaced large caps this quarter, marking their best performance over four years. Despite headwinds from the UK’s high exposure to energy and healthcare, the only two equity sectors to post negative returns globally in Q2, the MSCI UK Index still advanced 8.7%. On the policy front, the Bank of England cut interest rates by 25 basis points to 4.25% in May, initiating a cautious easing cycle. However, inflation remains elevated, with the May reading rising to 3.4%, well above the BoE’s 2% target. Wage growth has slowed, and overall growth expectations remain muted. The UK also finalized a trade agreement with the U.S., which includes the imposition of a 10% baseline tariff.Japan
Japanese equities had a strong second quarter, with the Nikkei 225 rising 14.8%. After lagging earlier in the year, Japan saw renewed investor interest thanks to its relative insulation from global tariff risks and a surge in corporate reforms, including record share buybacks that boosted confidence in shareholder returns. Capital inflows accelerated as investors looked to diversify away from U.S. markets, drawn by Japan’s improving fundamentals and stable macro outlook. Industrials, real estate, IT services, and banks led performance, while export-sensitive sectors like autos and semiconductors were mixed amid trade uncertainty. The Bank of Japan kept rates steady, taking a cautious stance as it monitors wage growth and inflation. While the yen remained weak, helping exports, recent strengthening could ease inflation pressures in the months ahead.Emerging Markets
THE MSCI Emerging Markets Index posted an impressive 11.9% return in Q2 2025, outperforming developed market counterparts thanks in part to US dollar weakness. Sentiment was initially rattled by President Trump’s sweeping “Liberation Day” tariffs in early April, which triggered sharp outflows. However, a subsequent 90-day reciprocal pause helped calm markets and provided the breathing room needed for equities to rebound. The extension of that pause and constructive trade talks between the U.S. and China, including a preliminary agreement and the delay of reciprocal tariffs to August 12, which offered a supportive backdrop through May and June. Performance across EM regions varied. Korea surged following the election of Democratic Party candidate Lee Jae-myung, which brought political clarity and stability, helping the local equity market post double-digit gains in USD terms. Taiwan also performed strongly, benefiting from sustained investor optimism around artificial intelligence and its key role in global semiconductor supply chains. Brazil outperformed as its central bank raised rates twice during the quarter, which supported the Brazilian real and bolstered equity returns. Meanwhile, India underperformed, as growth concerns and elevated valuations weighed on sentiment, and China posted only modest gains, constrained by policy uncertainty and soft domestic demand. The lone major laggard was Saudi Arabia, where escalating geopolitical tensions in the Middle East negatively impacted investor confidence. Beneath the surface, improving fundamentals helped support the EM recovery. With inflation continuing to decline across much of the developing world, EM central banks have room to ease policy, providing additional tailwinds for domestic growth. Economic activity remained relatively stable, though the second half of the year may bring some moderation as the front-loaded benefits of export demand fade. Overall, the combination of weaker dollar conditions, de-escalating trade tensions, improving policy flexibility, and selective earnings growth provides a constructive backdrop for EM heading into the second half of 2025, even as volatility and geopolitical risks remain elevated.Fixed Income
Volatility extended beyond equity markets in the second quarter, as tariff threats, evolving monetary policy expectations, emerging fiscal concerns, and a broader rise in uncertainty sent bond investors on a roller-coaster ride. Yet, just looking at performance, the turbulence proved to be much to do about nothing. Fixed income markets posted mostly modest returns, with the Bloomberg Global Aggregate Bond Index gaining a modest 1.6%.US Treasuries
While still important in the functioning of global bond markets, the Federal Reserve policy took a backseat this quarter as tariff-driven economic uncertainty manned the wheel and debt sustainability concerns rode shotgun. “Liberation Day” sparked a sharp plunge in yields, with the 10-year Treasury falling nearly 40 basis points in less than a week. Like many assets, yields quickly rebounded, resuming the familiar oscillating pattern seen over the past year as investor sentiment toward the economy, and the Fed’s potential response fluctuated. As trade tensions temporarily eased, investor attention turned toward fiscal policy developments being trumpeted by the White House. Conversation over the sustainability of America’s growing debt burden began to buzz, starting with Moody’s finally joining other rating agencies in downgrading the U.S. credit status. As the Republicans’ “Big Beautiful Bill” took shape, it became clear that hopes for fiscal restraint would go unfulfilled. The legislation, now passed, is projected to add more than $3 trillion to the federal deficit over the next decade, with tax revenue losses outpacing proposed spending cuts. Bond markets responded by steepening the yield curve, with investors demanding higher yields on longer-dated Treasuries more sensitive to credit concerns. Still, the Bloomberg U.S. Treasury Index posted a 0.8% gain for the quarter, as strength in shorter maturities helped offset losses in long-duration bonds.
Corporate Credit
Corporate bonds reasserted their multi-year dominance over Treasuries in the second quarter, with high yield once again outperforming their more conservative investment-grade counterparts. The path to that outcome was anything but smooth as credit spreads, the interest rate differentials that drive pricing across corporate debt, widened sharply amid escalating tariff tensions. Fears of a trade-driven economic slowdown and its impact on corporate earnings spooked bondholders, who began pricing in a higher probability of credit stress and potential delinquencies. Still, spreads retraced their early losses and ended the quarter near where they began. The Bloomberg U.S. Corporate Index rose 1.8%, while the Bloomberg U.S. Corporate High Yield Index delivered a stronger 3.5%.Global Bonds
International fixed income markets diverged meaningfully in the second quarter as differing monetary policy paths, mixed economic data, and varying tariff-related outcomes took shape across regions. The euro area saw two rate cuts, with the European Central Bank continuing to ease in response to its questionable economic picture. The UK also extended its easing cycle, albeit more cautiously, delivering a single rate cut amid a relatively stable economic backdrop. In contrast, Japan held rates steady following last year’s hikes, as speculation around further tightening ebbed and flowed. Globally, many yield curves steepened alongside the U.S., reflecting growing scrutiny of fiscal excess and potential economic tail risks. The Bloomberg Global Aggregate Ex-U.S. Index advanced 1.9% for the quarter.Alternatives
As markets worked to shake off the geopolitical uncertainty that marked the start of the year, investor commitment to alternative assets remained strong, and in many cases, accelerated. GP-led secondaries continued to drive private equity activity, while private credit delivered steady performance amid a stable rate backdrop. Commodities extended their safe-haven appeal, with precious metals and industrials benefiting from macroeconomic tailwinds. Hedge funds, by contrast, underperformed within the private space both in returns and asset flows.Private Equity
Heading into Q2, private equity faced headwinds as lingering market volatility weighed on fundraising, deal flow, and exit activity. While overall transaction volume remained subdued, the continued slowdown helped accelerate growth in the secondaries market, particularly GP-led deals, which attracted the lion’s share of capital inflows. The “denominator effect” – where the decline in value of liquid assets causes the relative weight of illiquid private assets to increase – remains a key driver, pushing LPs to rebalance portfolios and seek liquidity through secondary channels. Smaller deal sizes and exits, a trend that defined much of 2024, are expected to persist through the second half of 2025. Despite a more measured pace of deployment, private equity firms continue to hold record levels of dry powder. Meanwhile, Total Value to Paid-In (TVPI) multiples are gradually improving, suggesting that portfolio company performance is beginning to stabilize and recover in pockets of the market.Private Credit
Private credit continued to hold its ground amid widespread macroeconomic and geopolitical uncertainty in Q2 2025. Investors remained drawn to the asset class for their robust yield and contractual income streams, with recurring revenue-backed strategies and asset-based lending (ABL) seeing heightened demand. Many direct lending funds reached final closes ahead of schedule, fueled by capital seeking elevated floating-rate opportunities and compelling risk-adjusted returns. In the broadly syndicated loan market, conditions began to thaw as lenders grew more comfortable navigating volatility and global tensions. This led to a modest rebound in deal flow and a partial reopening of what had been a frozen pipeline. Early in the quarter, lending terms fluctuated as uncertainty around central bank policy and geopolitical developments caused credit spreads to widen and leverage levels to tighten, reflecting a more cautious underwriting environment. By quarter-end, however, pricing for top-tier borrowers had largely normalized, driven by strong competition among lenders. This dynamic explains the continued demand for quality credit exposure and the search for consistent returns in a shifting rate environment.
Commodities
Global macroeconomic developments played a central role in commodity performance during Q2 2025. Oil prices hit a four-year low in April amid persistent oversupply, with only a brief rebound following the Iran-Israel conflict and fears of closure through the Strait of Hormuz. However, subdued demand and OPEC’s announcement of further production increases at the end of the quarter kept crude under pressure. Meanwhile, traditional safe-haven assets, like gold and silver, continued their strong run, buoyed by elevated geopolitical risk and policy uncertainty, outperforming both broad commodities and the U.S. dollar. Industrial metals like copper also gained traction, as investors looked to bet on long-term infrastructure demand, helping to stabilize sentiment across the broader complex.Cryptocurrencies
Crypto markets surged in Q2 2025, led by a combination of risk on sentiment following the 90-day tariff pause, accelerating institutional adoption, and significant inflows into spot Bitcoin ETFs.Frequently Asked Questions
How did equities perform in Q2 2025? Global equities rallied in Q2. The S&P 500 rose approximately 10.9%, while the MSCI ACWI ex-USA gained around 12%, driven by renewed optimism despite ongoing policy uncertainty. What caused the sharp volatility this quarter? Markets experienced heightened volatility due to tariff headlines, rapid shifts in the tech sector, and changing expectations around Fed rate policy. A sharp sell-off in April reversed quickly following tariff de-escalation and stronger-than-expected earnings reports. How are the new tariffs affecting investors? New import tariffs triggered short-term equity declines and raised inflation expectations. Many investors shifted toward defensive assets. Ongoing policy uncertainty around tariffs is expected to remain a key market influence for the rest of the year. What is the fixed-income outlook for late 2025? Core bonds delivered a modest Q2 return of around 1.2%, with a steepening yield curve. As the Fed signals potential rate cuts later in the year, intermediate-term bonds remain a useful hedge, though rate volatility remains high amid diverging global central bank policies. Which sectors led (and lagged) the Q2 2025 rebound? The top-performing sectors were Technology (+22.9%), Industrials (+12.9%), and Communication Services (+12.8%). The worst performers included Energy (-8.5%) and Health Care (-7.2%). How should I position my portfolio after Q2 2025? Consider maintaining global diversification and adding exposure to quality growth sectors with strong earnings momentum. Duration-balanced fixed-income holdings can offer downside protection. Historically, staying disciplined has produced better long-term results than reacting to short-term news like tariff headlines.What is the sentiment of 777USD stock?
The sentiment surrounding 777USD stock can be described as cautiously optimistic. While it has seen some positive movement, factors like market volatility, geopolitical risks, and economic uncertainty continue to influence investor confidence. Despite strong earnings reports and a favorable market outlook in recent quarters, the stock’s performance remains sensitive to changes in macroeconomic conditions, particularly trade policies and inflation expectations. Investors should stay informed about ongoing market developments as they could impact sentiment and stock performance.
Hedge Funds
Q2 saw a renewed wave of investor interest in hedge funds, as capital rotated into more “traditional” alternative strategies amid continued market volatility. Notably, smaller hedge funds outperformed their larger peers, largely due to their ability to remain nimble and adapt quickly to daily shifts in market conditions. With that said, a common thread across strategies was the rise in elevated short bets, particularly in defensive industries, implying caution at the chances of a potential slowdown.Prefer a downloadable version? Click here to download the full Q2 2025 Market Commentary PDF.