
When it comes to spotting market trends and cutting through the noise of price swings, few are as widely used as moving averages. These indicators are used by traders in technical analysis to smooth out short-term volatility to reveal the bigger picture. There are two distinct yet similar moving averages that we will focus on: Simple Moving Average (SMA) and Exponential Moving Average (EMA).
A simple moving average is the sum of stock prices over a specified period and then divided by the amount of stock prices.
The formula is seen as:

Example: A 13-period SMA is just the average of the last 13 closing prices. You add them up and divide by 13. Because it smooths out short-term fluctuations, traders and investors tend to use SMA to have a clearer view of the overall trend.
Unlike the SMA, which weighs all prices equally, an Exponential Moving Average assigns more weight to recent closing prices. Therefore, EMA will react significantly quicker to recent price fluctuations, making it ideal for traders wanting to quickly identify short-term trends.
More short-term traders usually prefer EMA because of its’ ability to point out trends quickly, often using 8,12, and 20 day periods.
How are they different?
Different investor personalities prefer to use SMA or EMA depending on their trading style, objective, and the volatility of the security they are trading.
Common users of SMA’s are usually longer-term investors that want to view a more stable trend indicator that is less likely to provide false signals and offer a clearer view of broader direction.
EMA’s are mostly used by shorter-term investors that want a more responsive indicator of recent momentum shifts and trends.
Here are some practical applications for moving averages for investors:
Trend Confirmation: Use 5, 8, and 13 week SMA’s, when the shorter-term SMA’s (5 and 8) are above the longer-term SMA (13) in descending order (5 above 8 above 13), it can indicate upside trend confirmation.
Crossovers:
Golden Cross: when the shorter-term moving average, like the 50 day SMA, crosses above the longer-term moving average, like the 200 day SMA. This indicates a bullish trend.
Death Cross: when the shorter-term moving average (50 day) crosses below the longer-term moving average (200 day). This indicates a bearish trend.
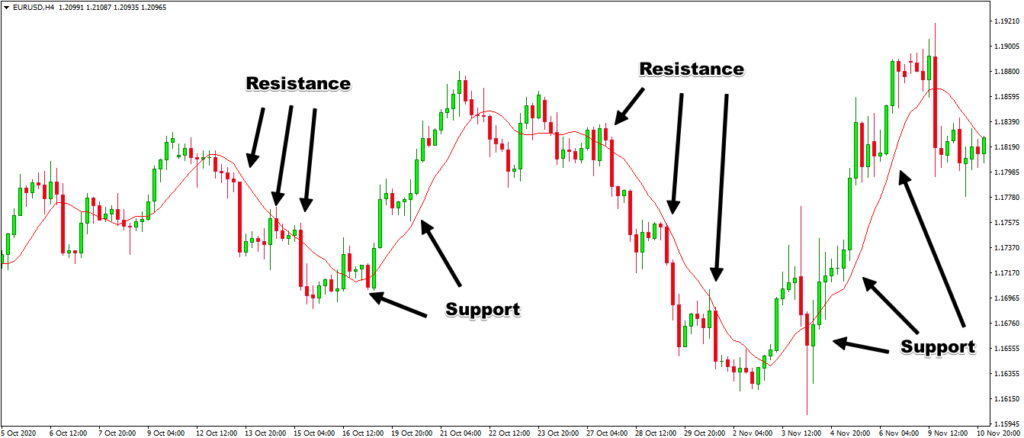
Support & Resistance: In a bullish uptrend, the moving average line can act as a support for the price to bounce off before going higher. In a downtrend, the moving average line may act as a boundary of resistance that the price cannot break through.
Moving averages are important tools for investors to identify prevailing trends in the market. At IWS, we incorporate moving averages alongside other key indicators such as price action, volume, and momentum to form a more complete view of market behavior. These tools work together within our broader investment process to help guide decisions and manage risk. In upcoming pieces, we’ll dive deeper into how we use each of these indicators in practice.