
Market Commentary
After a turbulent week, stocks have rebounded, and bond yields have fallen as investors await tomorrow’s crucial Consumer Price Index (CPI) report. The markets received a boost this Tuesday morning with the release of the Producer Price Index (PPI) data, which rose less than expected—a positive signal for those concerned about inflation.
In recent weeks, recession fears have dominated market sentiment, leaving investors searching for signs of stability. A lower-than-anticipated CPI reading tomorrow could be a welcome development for markets, eager to recover from the year’s steepest pullback. Notably, the VIX, often referred to as the market’s fear gauge, which had more than doubled last week, has since retreated to its previous levels.
However, as more economic data becomes available, the market’s reaction will be key. Disinflationary trends may be cheered by investors, but there’s also the risk that signs of a faster-than-expected economic slowdown could dampen enthusiasm. Tomorrow’s CPI report, followed by retail sales data on Thursday, should provide further clarity on the economic outlook.
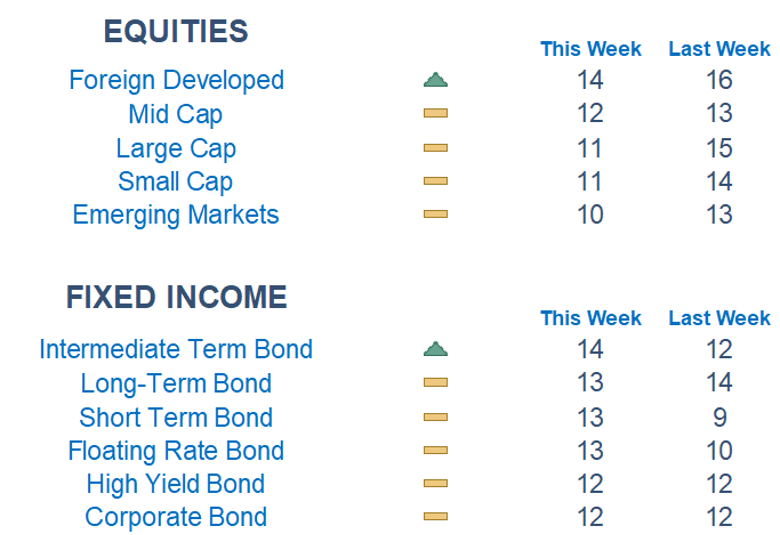
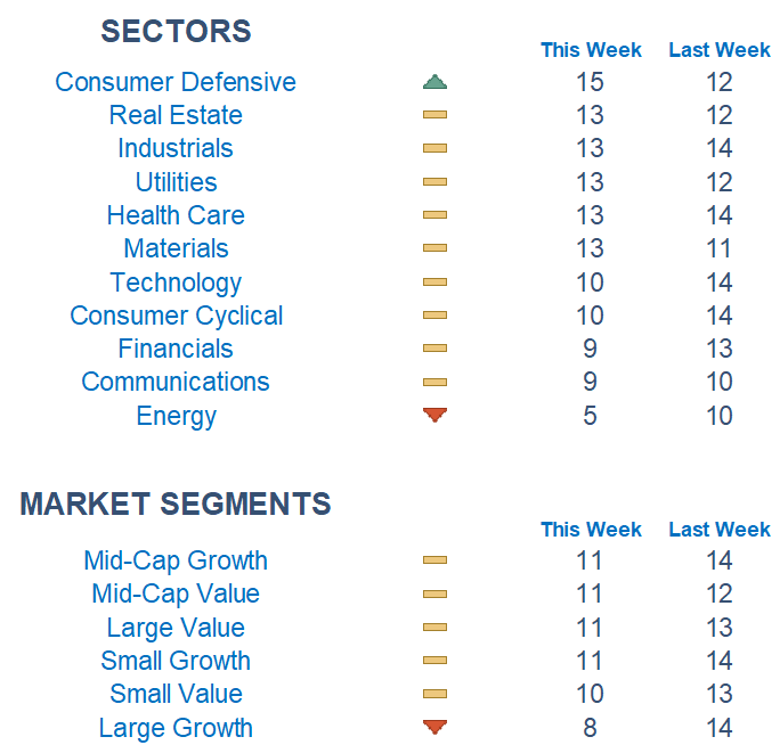
Newton models are beginning to show signs of relief, with improvements in the rate of change across many broad indices. While there are still challenges to overcome before declaring a return to an uptrend, there are encouraging developments. Real Estate and Defensive sectors remain strong, but we’re also seeing early signs of recovery in previously hard-hit areas like Technology and Communications.
Economic Releases This Week
Monday: Monthly US Federal Budget
Tuesday: NFIB Optimism Index, Producer Price Index, Atlanta Fed President Bostic Speech
Wednesday: Consumer Price Index
Thursday: Retail Sales, Initial Jobless Claims, Industrial Production, Philadelphia Fed President Harker
Speech
Friday: Housing Starts, Building Permits, Home Builder Confidence Index, Chicago Fed President Goolsbee Speech
Stories to Start the Week
The US ordered a guided missile submarine to the Middle East ahead of an anticipated Iran attack.
Starbucks announced that it is replacing its CEO with Chipotle chief Brian Niccol.
The US is pursuing to push Venezuelan President Nicolas Maduro to give up power in exchange for amnesty as evidence emerges he lost last month’s election.
How the Paris Olympics spun ratings gold for NBC and Peacock.

What is Newton?
Our Newton model attempts to determine the highest probability of future price direction by using advanced algorithmic and high-order mathematical techniques on the current market environment to identify trends in underlying security prices. The Newton model scores securities over multiple time periods on a scale of 0-20 with 0 being the worst and 20 being the best possible score.
Trend & level both matter. For example, a name that moves from an 18 to a 16 would signal a strong level yet slight exhaustion in the trend.
Technical trading models are mathematically driven based upon historical data and trends of domestic and foreign market trading activity, including various industry and sector trading statistics within such markets. Technical trading models, through mathematical algorithms, attempt to identify when markets are likely to increase or decrease and identify appropriate entry and exit points. The primary risk of technical trading models is that historical trends and past performance cannot predict future trends and there is no assurance that the mathematical algorithms employed are designed properly, updated with new data, and can accurately predict future market, industry and sector performance.