ThoughtfulInvestmentSolutions
Serving high-net-worth individuals, families, and institutions with integrity, precision, and an unwavering fiduciary commitment.

The Waterloo Way
We are Waterloo Capital Management, an SEC registered investment advisory firm and fiduciary — always acting in the best interest of our clients. Our focus and commitment is to help each client accomplish their specific goals and objectives.
Waterloo Capital Austin is a collaborative team of experts delivering tailored solutions to high-net-worth and institutional clientele across Texas and beyond.
Partner Firms Powered By Waterloo


Complete Wealth Management Solutions
Waterloo's 360° Critical Infrastructure provides the foundation — combining investment access, operational support, client service, and technology — so you can scale efficiently while staying true to your identity.
Dynamic Wealth Management Platform
Brings together financial & estate planning, public market, private market, and family office services. We utilize proprietary cutting-edge technology to enhance client portfolios and effectively manage risk.
Intelligent Wealth Solutions
Premier internal asset management and public market investment platform offering specialized services and oversight in the design, implementation, management, and monitoring of investment strategies.
Financial Planning
We understand our clients through extensive due diligence and create a customized plan to address personal, business, and estate planning needs with an emphasis on minimizing taxes and liability protection.
Family Office Services
Our family office services platform provides families with the full suite of comprehensive services to help simplify and manage wealth today and for future generations.
Institutional Quality Alternatives
Waterloo's private market investment platform provides unparalleled access to top alternative investment managers around the world. Our clients invest alongside university endowments and corporate pension plans.
Let's Build Your Wealth Strategy Together
Core Values
Waterloo Has Integrity
We treat every business decision — from agreements with advisors and vendors, to decisions about investment strategies — with high moral and ethical standards. We believe that having compassion and integrity will continue to pay dividends in our professional and personal lives.
“High moral and ethical standards in every decision.”
Waterloo Has Compassion
We are empathetic to our clients and advisors. We know how hard it can be to perform as an advisor, and we take empathy into account when we interface with our team. Waterloo strives to ensure that everyone feels safe and advocated for, independent of their role.
“Empathy in every client and team interaction.”
Waterloo Does Whatever It Takes
Waterloo employees work hard. We do not stop until there is a timely solution or resolution to a problem. While there are defined roles and responsibilities, nobody is too good to help our employees, advisors, or clients when there is a pressing need.
“Ownership mentality from every member of our team.”
Market Intelligence & Analysis

This Week on Wall Street – Week of March 16th
U.S. indexes are starting the week on a more constructive note, with stocks and bonds both finding relief as markets digest recent macro developments.

Last Week on Wall Street – March 14th, 2026
S&P 500: -1.60% · DOW: -1.99% · NASDAQ: -1.26% · 10-YR Yield: 4.28%. A volatile week as macro headwinds persisted across major indices.
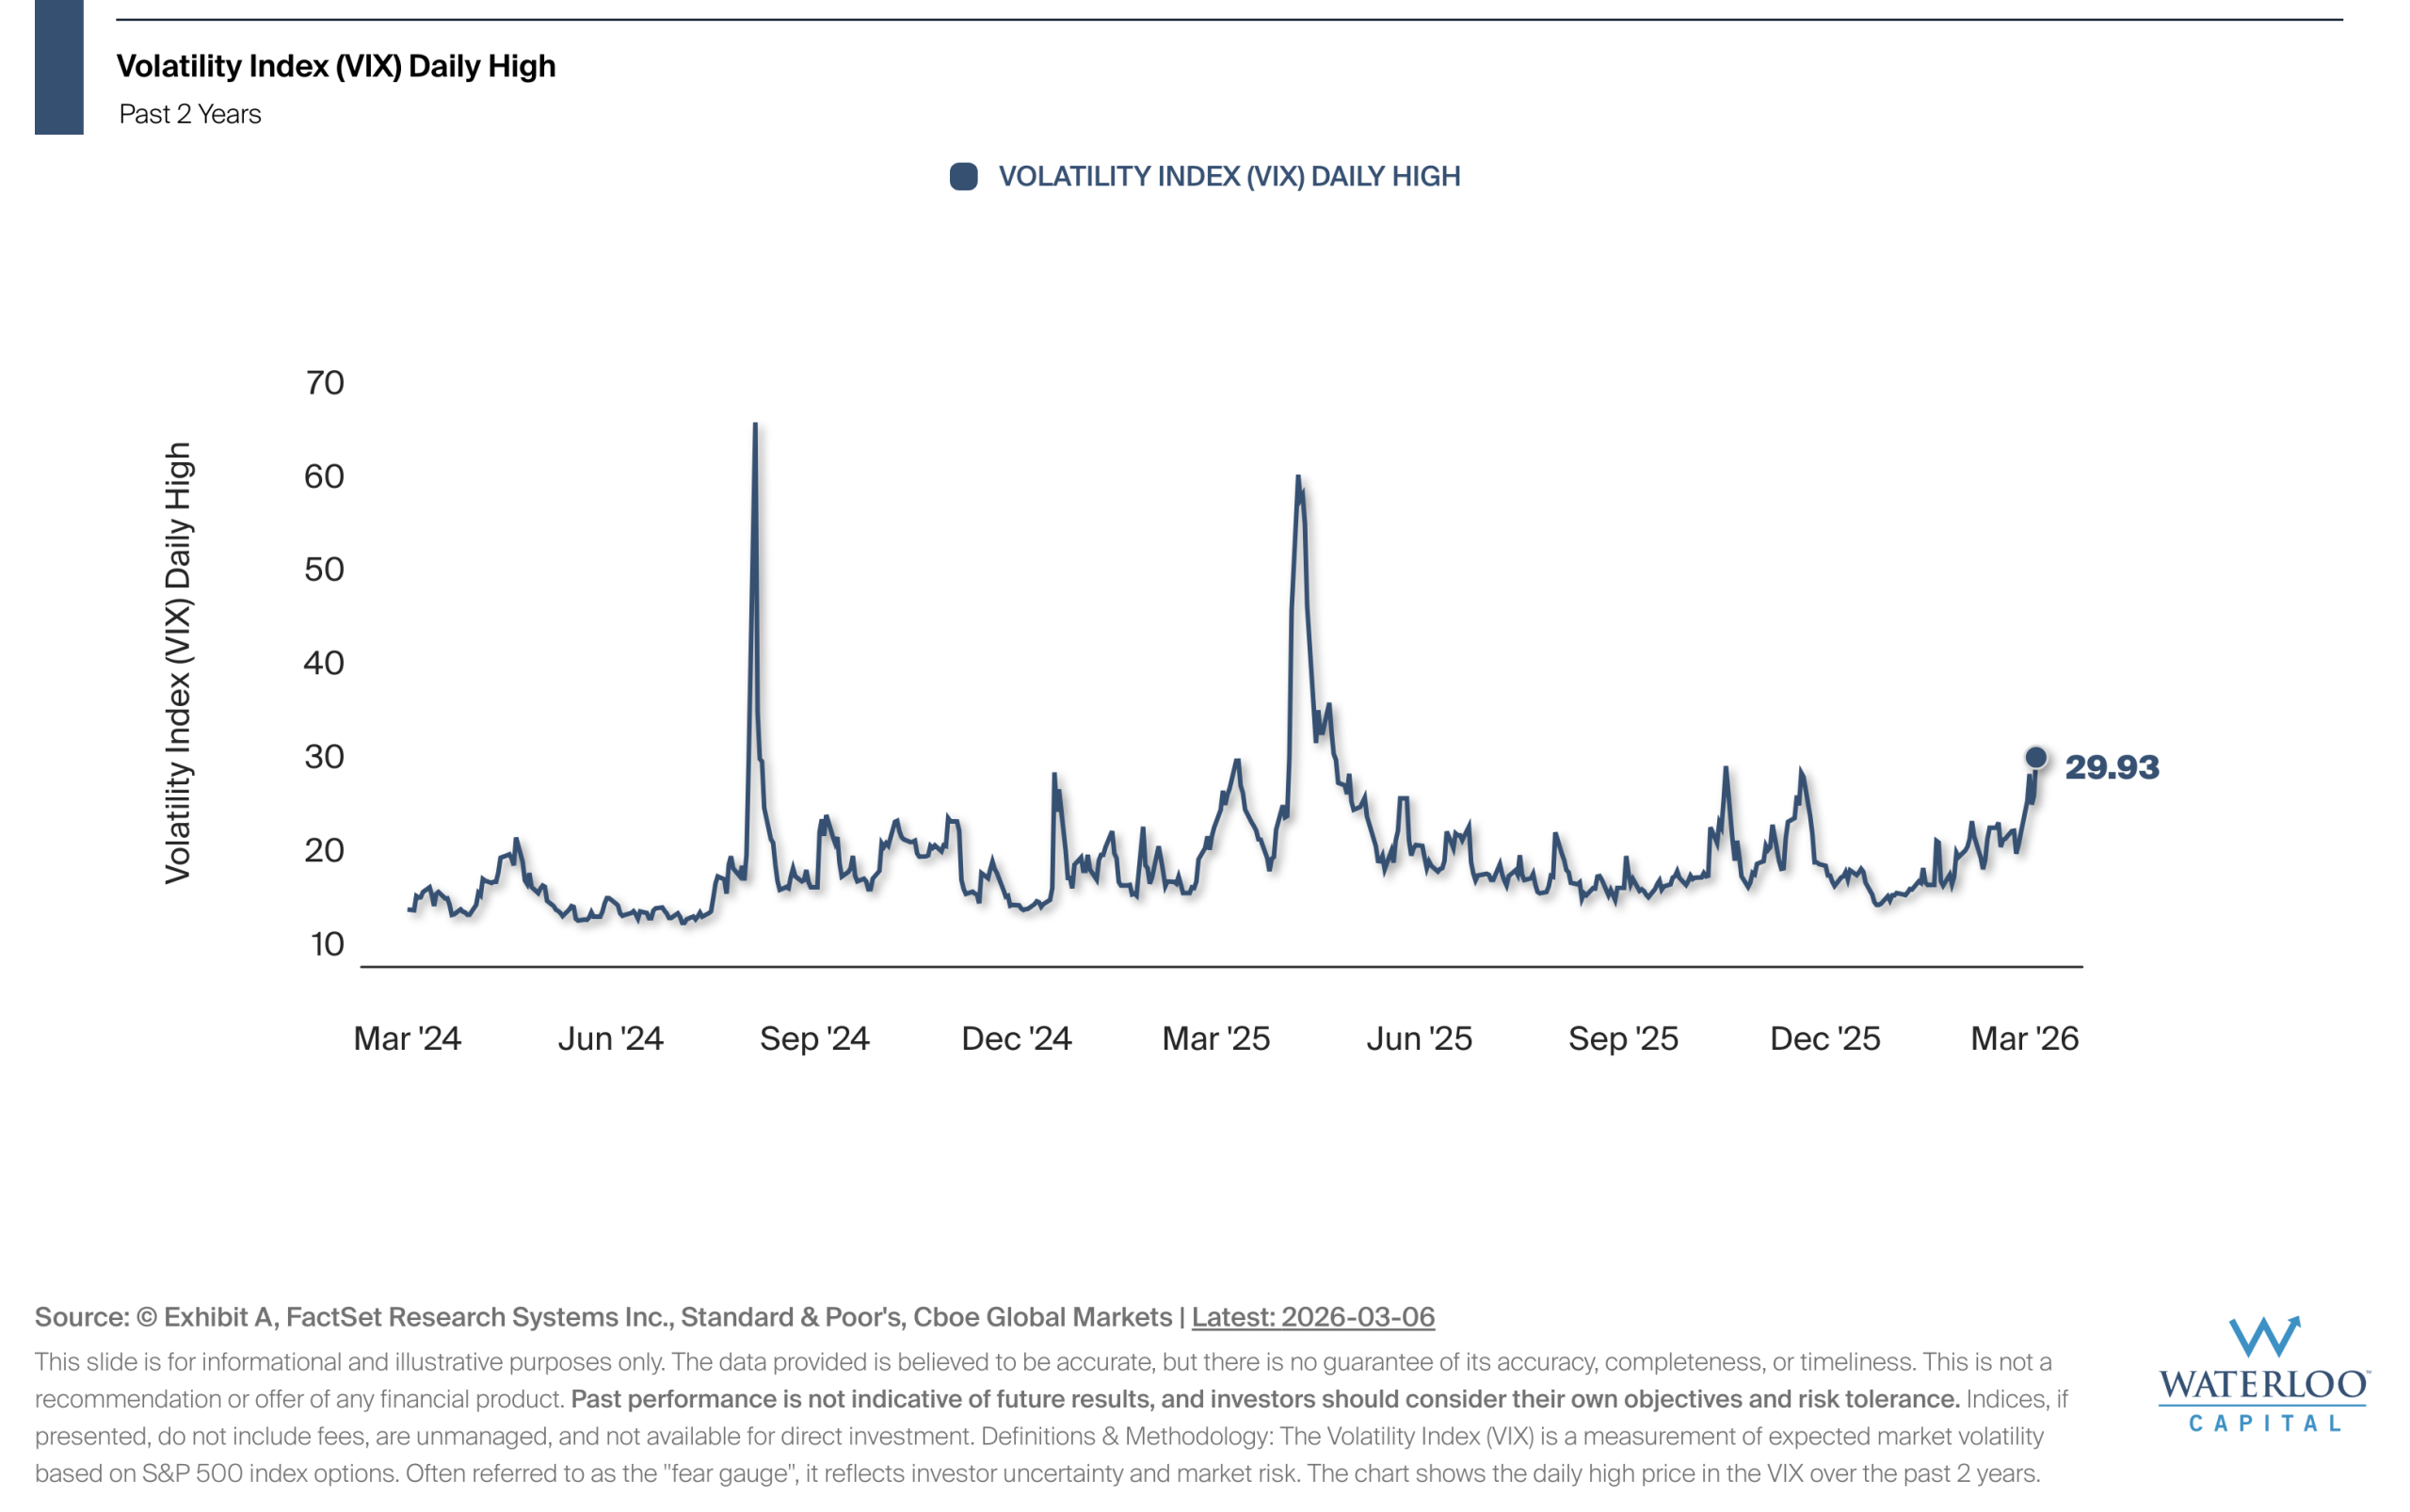
Chart Of the Week – A Short-Term View of Stock Volatility
The Volatility Index (VIX) is a widely used measure of market volatility, often referred to as the 'fear gauge.' Here's what it's telling us now.
Subscribe to Our Newsletters
Select the newsletters you'd like to receive and stay up to date with Waterloo Capital's latest market perspectives.
Start Your Wealth Journey Today
Whether you're a high-net-worth individual, a family navigating complex wealth, or an institutional client seeking specialized investment solutions, our team is ready to discuss your unique needs.