
MARKET COMMENTARY
Today marks the third week of the government shutdown, with Washington still in gridlock over a resolution. Beyond delayed pay for federal workers, stalling of all non-essential services, and permanent layoffs now flowing down from the White House, the shutdown’s reach extends to delaying key economic data releases and creating a data vacuum for investors. Since it began, several health checks on the labor market needed for gauging the Federal Reserve’s next moves have been missed. CPI, originally scheduled for release on Wednesday, has now been pushed to the 24th as the government recalls staff to ensure its eventual publication. In the meantime, alternative data sources are stepping in to offer rough estimates of how the economy is holding up.
Adding to the mix, Q3 earnings season officially kicks off this week with the big banks leading the way. The setup is very different from last quarter. If you still remember, we were coming off the “tariff tantrum” where expectations were slashed due to fears over how new and threatened duties would hit profits. That low bar and a quick unwinding of the harshest tariff scenarios led to a lot of upside surprises. This time, however, the situation has flipped. A few months of solid economic data and a surging equity market have lifted both the bar for results and valuations. As a result, stocks will be more vulnerable to swings based on their reports and the market more susceptible to volatility.
Friday’s negative price action, which followed reports that Trump may take a tougher stance on China than previously thought, dealt the first meaningful hit to the recent leg of the bull rally. The percentage of stocks trading above their 50-day moving average dropped sharply from the low-60s to the mid-30s. Two stories could be told here: 1. a healthy pullback after a long stretch without major declines or 2. a signal that the momentum that has been fading for weeks was added to by the sell-off and marks the next stage of a stagnation. While we lean toward the former given the strong technical support still in place, the latter scenario has gained some probability points.
Newton Model Insights:
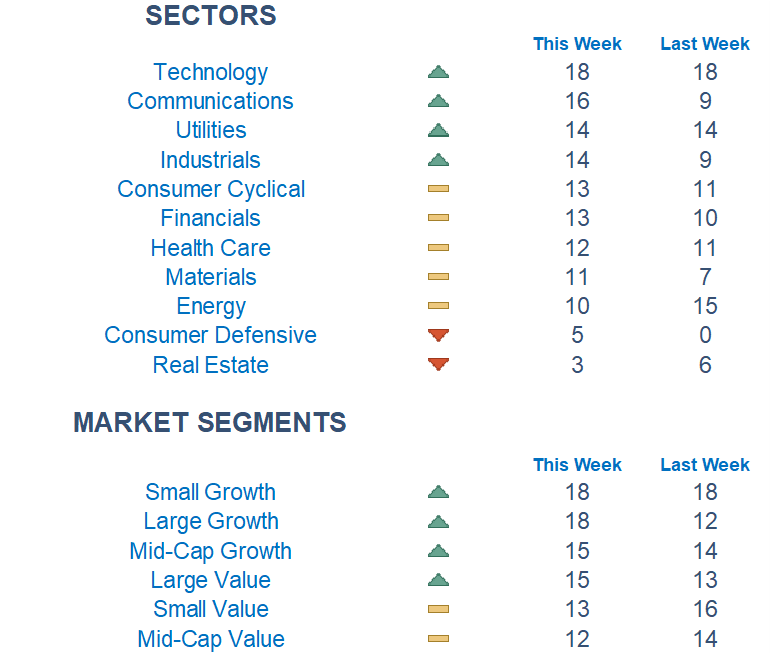
Our Newton model highlights a barbell of momentum forming across global equities with strength among established Large Cap names pairs with solid trends in more speculative Small Caps. Growth is dominating across market caps as shown in the continued preference for Technology and Communications. Emerging Markets remain favored over Developed, a theme that has gone on for what feels like forever. Declining yields support the long bed the rankings. Defensives, however, lagged and now sit at the bottom with the lowest possible score.
Economic Releases This Week
Monday: None
Tuesday: None
Wednesday: Fed Beige Book
Thursday: Initial Jobless Claims*, Retail Sales*, Producer Price Index*
Friday: Housing Starts*
*Subject to delay given US government shutdown
Stories to Start the Week
Under the terms of a US-brokered ceasefire that Israel and Hamas agreed to last week, Israel pulled its troops back from part of Gaza
As threatened before the government shutdown, the Trump administration sent layoff notices to thousands of government employees
France’s President Emmanuel Macron reappointed Sébastien Lecornu as prime minister just four days after he resigned from the post
Sister Jean Dolores Schmidt, the chaplain famous for cheering on the Loyola Chicago basketball team during the school’s 2018 run, passed at age 106

Our Newton model attempts to determine the highest probability of future price direction by using advanced algorithmic and high-order mathematical techniques on the current market environment to identify trends in underlying security prices. The Newton model scores securities over multiple time periods on a scale of 0-20 with 0 being the worst and 20 being the best possible score.
Trend & level both matter. For example, a name that moves from an 18 to a 16 would signal a strong level yet slight exhaustion in the trend.
Technical trading models are mathematically driven based upon historical data and trends of domestic and foreign market trading activity, including various industry and sector trading statistics within such markets. Technical trading models, through mathematical algorithms, attempt to identify when markets are likely to increase or decrease and identify appropriate entry and exit points. The primary risk of technical trading models is that historical trends and past performance cannot predict future trends and there is no assurance that the mathematical algorithms employed are designed properly, updated with new data, and can accurately predict future market, industry and sector performance.