
MARKET COMMENTARY
Markets roared even higher last week following another interest rate cut and more talk on the future of AI following multiple big-tech earnings reports. We’re now on day 34 of the U.S. government shut down. Luckily some important data, not reported by the government, will be released this week.
Purchasing managers will give insight into the manufacturing and services sectors. These leading indicators on how the economy is functioning will hopefully help fill the current data gap. Following weeks of missing jobless reports, ADP employment will gauge changes in the private sector. The October report with a full picture of unemployment numbers is supposed to be released Friday. Stay tuned to learn how consumers are also feeling with University of Michigan’s sentiment report.
Let’s dive deeper into what S&P and ISM services data will mean. After all, the services industry isn’t just part of the economy, it’s the engine that drives almost 80% of U.S. GDP. Although increasingly important with lack of government data, understanding what purchasing managers have reported gives early insight into the health of the economy. S&P and ISM gather data from similar sectors, but there are key differences. S&P paints a broader picture aggregating data from a mix of U.S. companies, small to large. ISM data released by the Institute for Supply Management and more closely looked at by investors, focuses on larger and more established companies, including some sectors that are not traditionally “services.” However, both data points will give investors a greater idea on whether business activity and the economy is ramping up or slowing down amidst the data shortage.
At the surface, markets are flourishing and the S&P 500 continues to reach all time highs. Looking a bit deeper, what looks like a healthy bull market is driven by all too familiar tech stocks. The heavy concentration with only market leaders rallying is creating what’s called a narrow breadth and a fragile, potentially unsustainable market. If the rest of the soldiers that make up the larger part of the market don’t step into action, either the generals will need to carry excess weight, or we’ll see a catch down trade – a correction that reminds investors a rally built on a few heavyweights rarely marches forever.
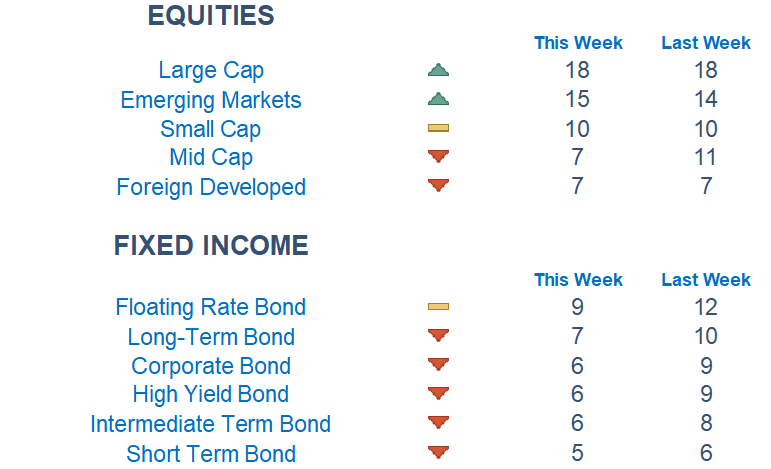
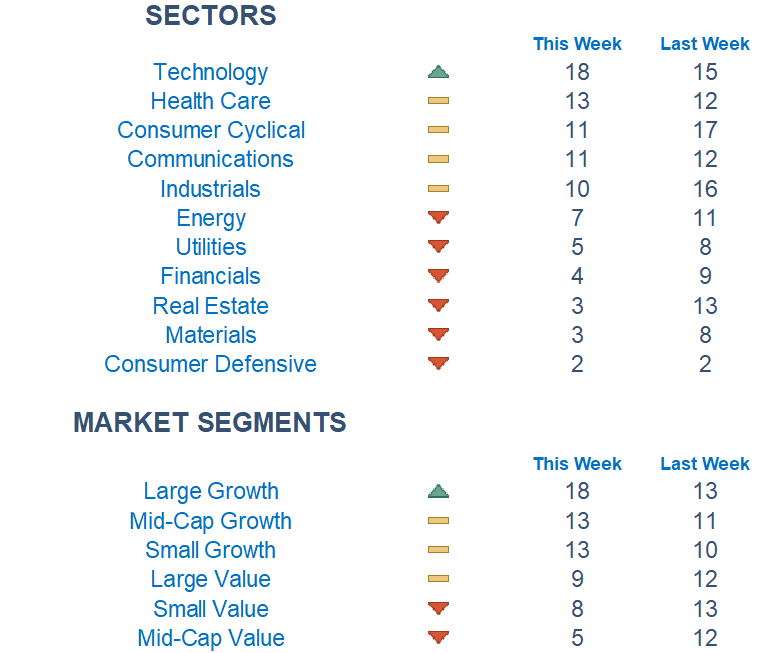
Newton Model Insights:
Our Newton model highlights several shifts this week. Large Cap stocks continue to dominate, while Mid Cap stocks dipped down. Fixed Income is looking less attractive this week with all bond types taking a hit. Tech and Healthcare continue to rise while all other sectors plumate, most notably Consumer Cyclicals, Industrials and Real Estate.
Economic Releases This Week
Monday: S&P Manufacturing PMI, ISM Manufacturing PMI
Tuesday: None
Wednesday: ADP Employment, S&P Services PMI, ISM Services PMI
Thursday: Initial Jobless Claims*
Friday: Jobs Report*, Consumer Sentiment
*Subject to delay given US government shutdown
Stories to Start the Week
Amazon’s CEO clarified that the layoffs the company announced were “not really financially driven,” but were about “culture.”
The Dodgers won the World Series in extra innings Saturday night to cap off back to back pennants
Car repossessions on the rise as delinquency rates on some auto loans hit record levels
The K-shaped economy and how high-income spenders are driving it

Our Newton model attempts to determine the highest probability of future price direction by using advanced algorithmic and high-order mathematical techniques on the current market environment to identify trends in underlying security prices. The Newton model scores securities over multiple time periods on a scale of 0-20 with 0 being the worst and 20 being the best possible score.
Trend & level both matter. For example, a name that moves from an 18 to a 16 would signal a strong level yet slight exhaustion in the trend.
Technical trading models are mathematically driven based upon historical data and trends of domestic and foreign market trading activity, including various industry and sector trading statistics within such markets. Technical trading models, through mathematical algorithms, attempt to identify when markets are likely to increase or decrease and identify appropriate entry and exit points. The primary risk of technical trading models is that historical trends and past performance cannot predict future trends and there is no assurance that the mathematical algorithms employed are designed properly, updated with new data, and can accurately predict future market, industry and sector performance.