
MARKET COMMENTARY
The government shutdown officially ended last Wednesday and we now await an influx of delayed data. This week we’ll get our first jobs report since we received August data months ago, giving us a lagged look at the state of the jobs market in September. We get the final round of awaited earnings this week, most notably Nvidia on Wednesday. Although expected to have a strong quarter, as we saw in reactions to other AI-related earnings, it’s uncertain how investors will react. Other companies to watch out for include Home Depot, Lowes and Walmart. To close out the week, Friday’s consumer sentiment report will tell us how consumers are really feeling as we head into the biggest shopping season of the year.
Thursday we’ll receive our first official peek into the jobs market in over 2 months. Data regarding September is expected to increase the unemployment rate to 4.4%. As we’ve seen this year, worries about unemployment have grown in recent months after the Bureau of Labor posted massive revisions in August, reflecting a significant slowdown in hiring. Those worries reached the Fed which found it necessary for 2 rate cuts since, ignoring concern over inflation pressures. In the past few months as AI spending continues to ramp up and companies look for more efficiency, thousands of layoffs from major companies including Amazon, Verizon, Microsoft, Intel, and many more, have taken place. That said, uncertainty has been a trend this year following the tariff tantrum, questions around AI spending, and the longest shutdown in history. This uncertainty has carried over to the job market, so finally gaining even delayed clarity on the state of employment will be a key indicator of where the economy has been and where it is headed.
Later in the week, we will see the crescendo of earnings season as Nvidia reports its Q3 results. Earnings expectations for the chipmaker are optimistic. However, concerns about extreme overvaluation in their market cap remain, with many believing an AI-driven correction may await in the future. We’ve seen this attitude from investors towards other major players this quarter, with AI spending looming over positive earnings. With Nvidia as our AI leader, combined with it’s $100 billion OpenAI deal and $4.3 billion portfolio invested heavily in AI infrastructure companies, it’s hard to say what awaits after Wednesday’s news. While the tech giant has proven resilient, rising over 33% this past year, skeptical investors have caused volatility in the stock market recently which could lead to a long-awaited turn away from a super concentrated tech market, shifting the focus on value.
Newton Model Insights:
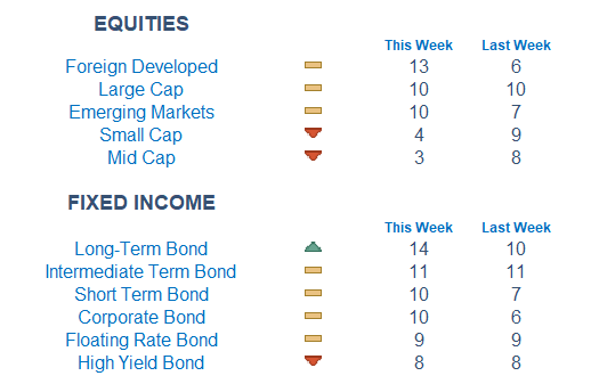
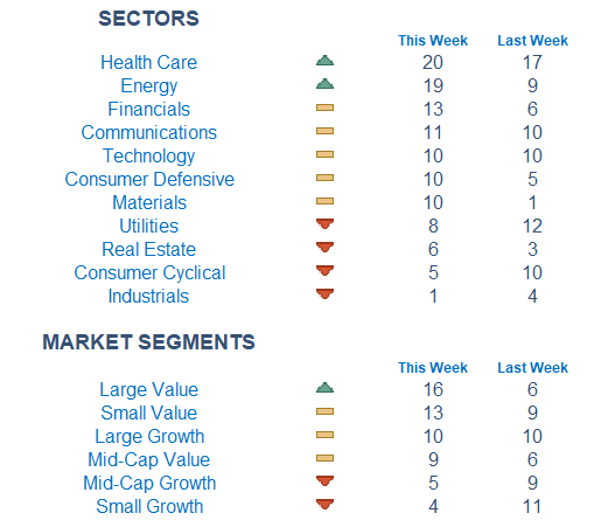
Our Newton model reflects a divergent market this week showing the highest possible range between sectors with Healthcare taking the top and Industrials sunk at the bottom. Foreign developed and emerging markets saw some hope this week, while small and mid-cap lost steam. Bonds are continuing to look relatively more attractive, long-term being the most promising. In a long awaited turn of events, Value is finally beating Growth with Large Value flying to the top driven by the winners in Healthcare.
Economic Releases This Week
Monday: None
Tuesday: None
Wednesday: Housing Starts, Building Permits, U.S Trade Deficit, FOMC Minutes
Thursday: U.S. Jobs Report, Initial Jobless Claims
Friday: Final Consumer Sentiment, S&P Services PMI, S&P Manufacturing PMI
Stories to Start the Week
FAA ended flight-reduction emergency order in light of Government reopening on Wednesday
Prop Bets Are Scandal Magnets for Sports Leagues but also Serious Moneymakers
Companies Predict 2026 Will Be the Worst College Grad Job Market in Five Years
Trump’s $2,000 tariff dividend checks would only be possible with a new law
Americans are heating their homes with bitcoin this winter

Our Newton model attempts to determine the highest probability of future price direction by using advanced algorithmic and high-order mathematical techniques on the current market environment to identify trends in underlying security prices. The Newton model scores securities over multiple time periods on a scale of 0-20 with 0 being the worst and 20 being the best possible score.
Trend & level both matter. For example, a name that moves from an 18 to a 16 would signal a strong level yet slight exhaustion in the trend.
Technical trading models are mathematically driven based upon historical data and trends of domestic and foreign market trading activity, including various industry and sector trading statistics within such markets. Technical trading models, through mathematical algorithms, attempt to identify when markets are likely to increase or decrease and identify appropriate entry and exit points. The primary risk of technical trading models is that historical trends and past performance cannot predict future trends and there is no assurance that the mathematical algorithms employed are designed properly, updated with new data, and can accurately predict future market, industry and sector performance.