
MARKET COMMENTARY
All major U.S. indexes are starting the week in the red after another rough stretch for stocks, with the S&P 500, Dow, and Nasdaq all posting their second straight weekly decline as oil’s surge weighed on sentiment. The ongoing conflict involving Iran has moved from a geopolitical worry to a real shock for energy markets. Attacks and shipping disruptions around the Strait of Hormuz have suspended a meaningful share of global crude and gas supply, and pushed U.S. crude above $100 per barrel, its largest weekly jump in decades. That has helped energy shares hold up better than most sectors, but it also reintroduces stagflation fears for investors, since higher oil can pressure both growth and inflation at the same time.
This week brings a heavy round of data that will give investors a broader read on how the economy is handling that backdrop. Wednesday’s Consumer Price Index will be the headline release, since any upside surprise in core inflation could make the Federal Reserve even more cautious heading into next week’s meeting. Later in the week, housing data and durable goods orders will speak to how higher rates and uncertainty are affecting construction and business investment, while Friday’s GDP and PCE numbers will round out the picture on growth and the Fed’s preferred inflation gauge. All of this follows a notably weak February jobs report, which showed outright job losses after January’s strength and pushed the unemployment rate up to 4.4%. For now, markets still expect the Fed to hold rates steady next week, but the combination of softer labor data and higher oil makes their path beyond March more complicated.
Technically, markets have been choppy and range bound, with day‑to‑day moves driven by alternating headlines about AI and the Middle East rather than any clear underlying trend. Index levels have not made much sustained progress in either direction over the past few months, yet volatility beneath the surface has been significant, with many stocks experiencing large intraday swings that add risk even as the averages appear relatively stagnant. The VIX, the main equity volatility gauge we track, recently spiked above 30, a level that signals elevated stress and increased demand for protection. It has since eased slightly, which fits with an environment where sharp reactions to news are common, but buyers are still stepping in near familiar support levels. In this kind of tape, it can look like conditions are improving because major selloffs are being contained. However, the ongoing headline driven swings and higher volatility mean investors still need to be mindful about position sizing, time horizon, and how much risk they are taking to stay invested.
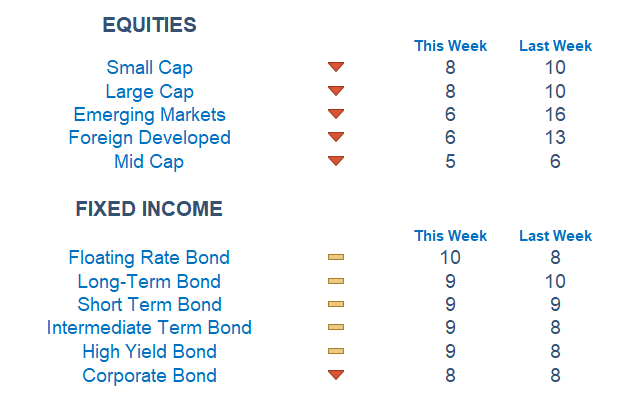
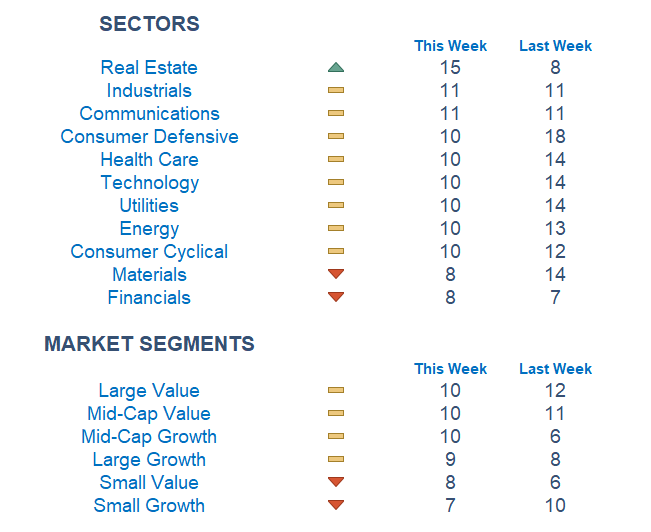
Our Newton model reflects the volatility we are seeing, with back and forth stretches of positive and negative signals across the market. For the first time this year, U.S. markets are looking more attractive than overseas, with both small and large cap indexes leading. That said, equity markets as a whole are weak, with all major indexes in the red relative to last week. Real estate has flipped to the upside again as the strongest sector, with industrials and communication services following. While small cap equities appear on the stronger end of the equity spectrum, a closer look at market segments shows that both small cap value and small cap growth are near the bottom of our rankings. Large and mid cap value remain among the winners this week, with mid cap growth joining them, although all of this is taking place in an overall weak environment.
Economic Releases This Week
Monday: None
Tuesday: None
Wednesday: Consumer Price Index
Thursday: Housing Starts, Building Permits, Initial Jobless Claims
Friday: GDP, PCE Index
Stories to Start the Week
OpenAI’s robotics division loses key leader Caitlin Kalinowski over disagreement on military deployment terms
Mojtaba Khamenei has been chosen as Iran’s new supreme leader
Oil surges above $100 per barrel as Iran war triggers record supply disruption with no end in sight
Prediction markets face questions on bets on the Iran war, from nuclear detonation to regime change
Is inflation cooling or strubbornly high? Both can be true

Our Newton model attempts to determine the highest probability of future price direction by using advanced algorithmic and high-order mathematical techniques onthe current market environment to identify trends in underlying security prices. The Newton model scores securities over multiple time periods on a scale of 0-20 with 0 being the worst and 20 being the best possible score.
Trend & level both matter. For example, a name that moves from an 18 to a 16 would signal a strong level yet slight exhaustion in the trend.
Technical trading models are mathematically driven based upon historical data and trends of domestic and foreign market trading activity, including various industry and sector trading statistics within such markets. Technical trading models, through mathematical algorithms, attempt to identify when markets are likely to increase or decrease and identify appropriate entry and exit points. The primary risk of technical trading models is that historical trends and past performance cannot predict future trends and there is no assurance that the mathematical algorithms employed are designed properly, updated with new data, and can accurately predict future market, industry and sector performance.
Disclousure:
Investing involves risk, including the possible loss of principal and fluctuation of value. Past performance is no guarantee of future results.
This newsletter is not intended to be relied upon as forecast, research or investment advice, and is not a recommendation, offer or solicitation to buy or sell any securities or to adopt any investment strategy. The opinions expressed are as of the date noted and may change as subsequent conditions vary. The information and opinions contained in this letter are derived from proprietary and nonproprietary sources deemed by Waterloo Capital to be reliable. The letter may contain “forward-looking” information that is not purely historical in nature. Such information may include, among other things, projection, and forecasts. There is no guarantee that any forecast made will materialize. Reliance upon information in this letter is at sole discretion of the reader. Please consult with a Waterloo Capital financial advisor to ensure that any contemplated transaction in any securities or investment strategy mentioned in this newsletter aligns with your overall investment goals, objectives and tolerance for risk. Additional information about Waterloo Capital is available in its current disclosure documents, Form ADV, Form ADV Part 2A Brochure, and Client Relationship Summary report which are accessible online via the SEC’s investment Adviser Public Disclosure (IAPD) database at www.adviserinfo.sec.gov, using SEC # 133705. Waterloo Capital is neither an attorney nor an accountant, and no portion of this content should be interpreted as legal, accounting or tax advice.