
MARKET COMMENTARY
Markets opened the week higher as investors welcomed signs of de-escalation in the Iran conflict followed by a sharp decline in oil prices this morning. This provided a much needed break after four consecutive weeks of losses across major US indexes driven by heated geopolitical tension and renewed inflation concerns.
Over the weekend, President Trump said Saturday night that the U.S. would strike and “obliterate” Iran’s power plants if the Strait of Hormuz was not reopened within 48 hours. Iran responded by threatening to target U.S. and Israeli energy, IT, and desalination infrastructure across the region. Tensions eased somewhat early Monday after both sides agreed to a temporary five-day pause on any strikes, creating space for diplomatic progress without further military escalation. The market took the development as a sign that oil disruptions could be contained for now, boosting risk appetite to start the week.
Looking ahead, they’ll be a few things to watch out for this week. Anthropic will meet with the Department of Defense in court Tuesday to challenge its designation as a “supply chain risk,” a decision that could have far-reaching impacts on the AI industry’s ties to government contracts. Investors will also be watching Friday’s University of Michigan Consumer Sentiment data, which should offer fresh insight into how households are handling persistent inflation, higher gas prices, and shaky market conditions. Together, these developments set the tone for a busy week that will test whether last month’s market decline has finally found a floor.
Treasury yields have been a major focus throughout the conflict. The 10-year yield briefly touched 4.43% this morning before easing to 4.33% following Trump’s update to pause any further turmoil for the week. These are the highest rates we’ve seen since July signaling stress around long-term inflation. The war has complicated the Fed’s path forward with energy-driven inflation pressures raising the odds of another rate hike later this year, despite the central bank holding rates steady at last week’s meeting. Traders are now pricing roughly a 45% chance of a rate hike and 37% chance of a rate cut given headline inflation remains elevated this year.
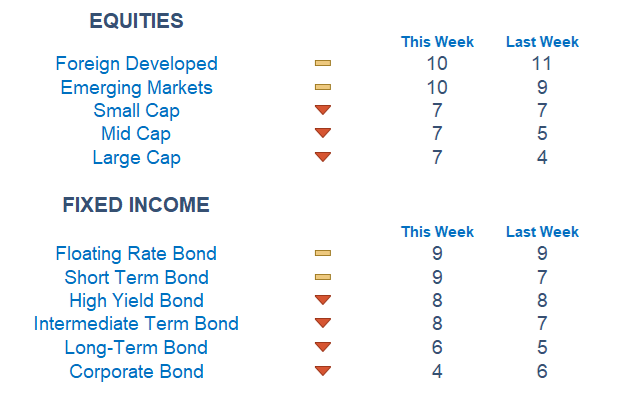
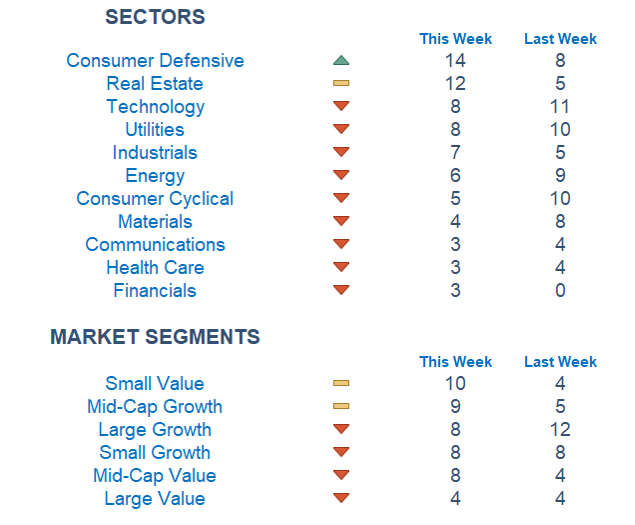
Our Newton model continues to signal an overall weak market across both equities and fixed income. Taking a closer look at sectors, consumer defensive saw an impressive boost along with real estate which has showed renewed strength for most of this year. While growth sectors are catching up, small cap value took the lead to start off this week.
Economic Releases This Week
Monday: None
Tuesday: S&P US Services and Manufacturing PMI
Wednesday: Import Price Index
Thursday: Initial Jobless Claims
Friday: Consumer Sentiment
Stories to Start the Week
Robert Mueller, former FBI director and special counsel in Trump-Russia probe, dies
ICE officers make their way to airports’ TSA checkpoints after Trump order amid partial shutdown
Historic Hawaii floods leave 2,000 people without power
Lawmakers to Introduce Bipartisan Bill Banning Sports Bets on Prediction Markets
The Hack That Turns Trump Accounts Into Multimillion-Dollar Tax-Free Nest Eggs

Our Newton model attempts to determine the highest probability of future price direction by using advanced algorithmic and high-order mathematical techniques onthe current market environment to identify trends in underlying security prices. The Newton model scores securities over multiple time periods on a scale of 0-20 with 0 being the worst and 20 being the best possible score.
Trend & level both matter. For example, a name that moves from an 18 to a 16 would signal a strong level yet slight exhaustion in the trend.
Technical trading models are mathematically driven based upon historical data and trends of domestic and foreign market trading activity, including various industry and sector trading statistics within such markets. Technical trading models, through mathematical algorithms, attempt to identify when markets are likely to increase or decrease and identify appropriate entry and exit points. The primary risk of technical trading models is that historical trends and past performance cannot predict future trends and there is no assurance that the mathematical algorithms employed are designed properly, updated with new data, and can accurately predict future market, industry and sector performance.
Disclousure:
Investing involves risk, including the possible loss of principal and fluctuation of value. Past performance is no guarantee of future results.
This newsletter is not intended to be relied upon as forecast, research or investment advice, and is not a recommendation, offer or solicitation to buy or sell any securities or to adopt any investment strategy. The opinions expressed are as of the date noted and may change as subsequent conditions vary. The information and opinions contained in this letter are derived from proprietary and nonproprietary sources deemed by Waterloo Capital to be reliable. The letter may contain “forward-looking” information that is not purely historical in nature. Such information may include, among other things, projection, and forecasts. There is no guarantee that any forecast made will materialize. Reliance upon information in this letter is at sole discretion of the reader. Please consult with a Waterloo Capital financial advisor to ensure that any contemplated transaction in any securities or investment strategy mentioned in this newsletter aligns with your overall investment goals, objectives and tolerance for risk. Additional information about Waterloo Capital is available in its current disclosure documents, Form ADV, Form ADV Part 2A Brochure, and Client Relationship Summary report which are accessible online via the SEC’s investment Adviser Public Disclosure (IAPD) database at www.adviserinfo.sec.gov, using SEC # 133705. Waterloo Capital is neither an attorney nor an accountant, and no portion of this content should be interpreted as legal, accounting or tax advice.