
MARKET COMMENTARY
Markets kicked off the week with renewed optimism following a newly announced trade agreement between the U.S. and the European Union. The deal, which imposes 15% tariffs on European imports (lower than the previously threatened 30%), helped ease investor concerns and lifted equities at the start of the session. However, the focus quickly shifted to a high-stakes week featuring a Federal Reserve policy decision, July’s nonfarm payrolls report, and earnings from several of the Magnificent Seven.
The Federal Reserve is widely expected to keep interest rates unchanged at this week’s meeting, with futures markets assigning just a 3% chance of a cut. Still, investors will be paying close attention to Chair Powell’s press conference for any guidance on a possible rate reduction in September. Currently, the probability of a September cut stands at roughly 64%. The Fed faces a complex backdrop of stubborn inflation and resilient growth, making its communication this week especially significant.
Inflation data will also be front and center, with the upcoming release of the Core Personal Consumption Expenditures (PCE) Price Index, the Fed’s preferred inflation gauge. Recent data shows core goods inflation, particularly in tariff-sensitive categories such as apparel and electronics, has picked up. If the PCE report confirms these trends, it could reinforce concerns that inflation is proving more persistent than expected, complicating the Fed’s path forward.
Labor market data will round out the week with Friday’s nonfarm payrolls report offering key insight into the strength of employment. Although retail sales and consumer demand have held up, there are emerging signs of strain. Continuing jobless claims recently hit three-year highs and labor force participation has slipped. The Fed projects unemployment to rise to 4.5% by year-end, up from 4.1% today, suggesting a gradual softening in labor demand may already be underway. Together, these developments will help shape market expectations around future Fed policy and economic resilience heading into the second half of the year.
Newton Model Insights:
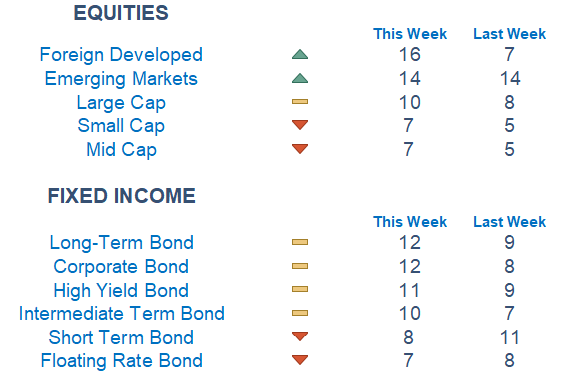
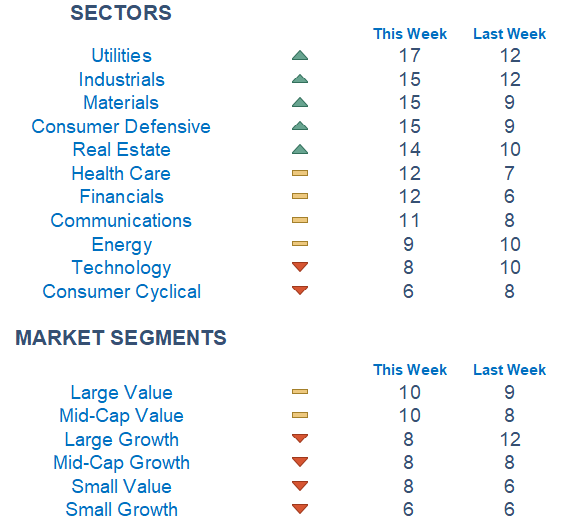
According to our Newton Model, both developed international and emerging markets have shown renewed strength relative to domestic equities. From a style perspective, large cap value currently leads, although momentum has deteriorated across all styles. Sector trends reflect a similar pattern of broad-based weakness. Utilities, industrials, and materials were the relative outperformers this week, while most cyclical sectors continued to lose ground. In fixed income, long-duration bonds are looking more attractive relative to their short-term counterparts, though overall sentiment toward the asset class remains subdued amid persistent rate uncertainty.
Economic Releases This Week
Monday: None scheduled
Tuesday: Advanced US Trade Balance, Advanced Retail & Wholesale Inventories, S&P Case-Shiller Home Price Index, Consumer Confidence, Job Openings
Wednesday: ADP Employment, GDP, Pending Home Sales, FOMC Interest Rate Decision, Fed Chair Powell Press Conference
Thursday: Initial Jobless Claims, Employment Cost Index, Personal Income & Spending, PCE Index, Core PCE Index, Chicago Business Barometer (PMI)
Friday: US Employment Report, US Unemployment Rate, S&P Final US Manufacturing PMI, ISM Manufacturing, Construction Spending, Consumer Sentiment (final), Auto Sales
Stories to Start the Week
Trump’s $750 Billion EU Energy Deal Collides With Market Reality
Global Baseline Tariff Will Likely be 15% – 20%, According to Trump
Ceasefire Takes Effect Between Thailand & Cambodia After 5 Day Border Battle
With Individual Home Buyers on the Sidelines, Investors Swoop Into the Market
Israel Begins Daily Pause in Fighting in 3 Gaza Areas to Allow “Minimal” Aid as Hunger Grows

Our Newton model attempts to determine the highest probability of future price direction by using advanced algorithmic and high-order mathematical techniques on the current market environment to identify trends in underlying security prices. The Newton model scores securities over multiple time periods on a scale of 0-20 with 0 being the worst and 20 being the best possible score.
Trend & level both matter. For example, a name that moves from an 18 to a 16 would signal a strong level yet slight exhaustion in the trend.
Technical trading models are mathematically driven based upon historical data and trends of domestic and foreign market trading activity, including various industry and sector trading statistics within such markets. Technical trading models, through mathematical algorithms, attempt to identify when markets are likely to increase or decrease and identify appropriate entry and exit points. The primary risk of technical trading models is that historical trends and past performance cannot predict future trends and there is no assurance that the mathematical algorithms employed are designed properly, updated with new data, and can accurately predict future market, industry and sector performance.