
MARKET COMMENTARY
The markets were on a steep downhill ride last week, but managed to end Friday on the upside. The Magnificent 7 experienced its worst week since April of last year, while the equal weight index reached a fresh record high. That said, the S&P 500 remained within 1% of its all-time high, so despite the heightened volatility, returns across the market are holding up. This further supports ongoing rotationout of big tech. While the largest names are not having the strongest year so far, other stocks within the index are maintaining overall market strength. This is a common pattern we’ve seen over the last few years, though previously it played out in the opposite direction, with a few tech leaders propping up the index while most other names lagged behind.
January’s job report was delayed due to the government shutdown and will now be released onWednesday. Forecasters say the unemployment rate will likely stay the same at 4.4%. The Consumer Price Index will be updated on Friday, where we expect a slight increase of 0.3% in core CPI. Together, these reports should provide a clearer picture of where the jobs market and inflation stand, an image that has been blurry for the past four months.
Market choppiness has been the dominant trend. One week, stocks rally and gain strength, delivering solid returns; the next week, we see a sharp slowdown, with stocks giving back those gains. Thispatterns explains why volatility has been a headline topic and why investors have been allocating more of their portfolio to gold in search of stability amid equity sell-offs. This move is often referred to as a “flight to quality” and a trend we believe will hold up throughout 2026.
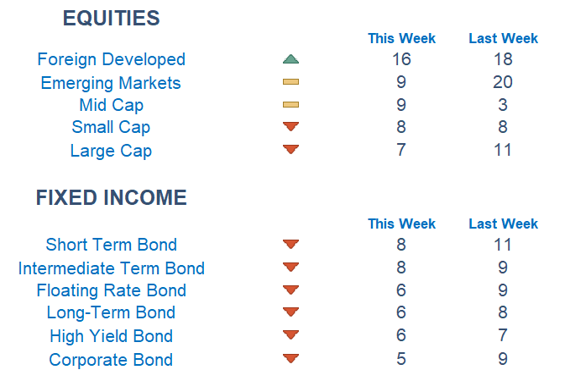
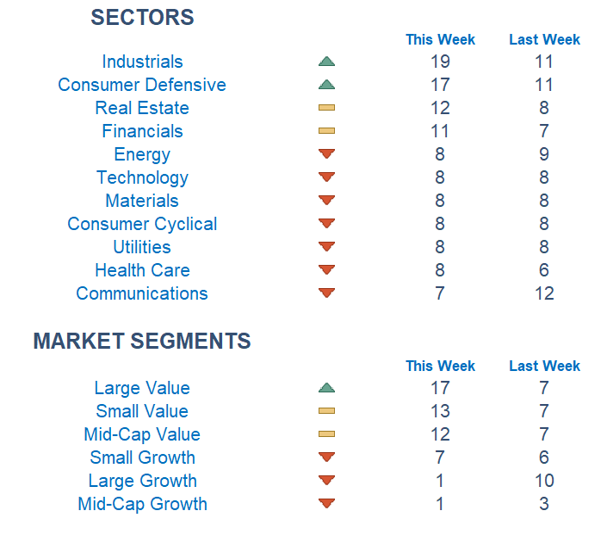
Our Newton model is delivering patterns similar to what we observed last week. Internationally, the outlook remains more favorable with foreign developed outperforming, while emerging markets saw a decline. At the sector level, industrials and consumer defensive are becoming more attractive, building on their recent outperformance. The focus on value continues, with large, mid and small-cap value stocks beating their growth counterparts.
Economic Releases This Week
Monday: None
Tuesday: US Retail Sales
Wednesday: US Jobs Report
Thursday: Initial Jobless Claims
Friday: Consumer Price Index
Stories to Start the Week
Novo Nordisk sues Hims & Hers over cheaper copycat versions of Wegovy pill, injections
Meta starts big week in court, with opening agreements beginning in New Mexico
Job hunters are so desperate that they’re paying to get recruited
Bad Bunny uses joy to put out political firestorm at Super Bowl Halftime
The mountain trama that ended With Team USA’s first gold of the Winter Olympics

Our Newton model attempts to determine the highest probability of future price direction by using advanced algorithmic and high-order mathematical techniques onthe current market environment to identify trends in underlying security prices. The Newton model scores securities over multiple time periods on a scale of 0-20 with 0 being the worst and 20 being the best possible score.
Trend & level both matter. For example, a name that moves from an 18 to a 16 would signal a strong level yet slight exhaustion in the trend.
Technical trading models are mathematically driven based upon historical data and trends of domestic and foreign market trading activity, including various industry and sector trading statistics within such markets. Technical trading models, through mathematical algorithms, attempt to identify when markets are likely to increase or decrease and identify appropriate entry and exit points. The primary risk of technical trading models is that historical trends and past performance cannot predict future trends and there is no assurance that the mathematical algorithms employed are designed properly, updated with new data, and can accurately predict future market, industry and sector performance.