
MARKET COMMENTARY
With earnings season upon us, speculation around heavy investment in AI continues to build. Last week, despite solid earnings from both Meta and Microsoft, the market reaction was polarized, with Meta’s stock moving higher while Microsoft’s declined. This coming week brings more Big Tech names including Google and Amazon, which should provide further insights into their 2026 capex plans, how Google is handling competition with OpenAI, and Amazon’s progress on efficiency. The big question remains: will the return on investment be strong enough to justify the spending?
Nonetheless, earnings doesn’t stop at Big Tech. We will also hear from most major healthcare names, including Pfizer, Novo Nordisk, and Eli Lilly. With the Trump administration’s efforts to lower prices across the pharmaceuticals industry for Medicaid programs, commentary on how these corporations plan to manage pricing and mitigate potential risks will be worth listening for.
It will also be a big week for labor data, beginning with the Job Openings and Labor Turnover Survey on Tuesday, followed by private-sector labor data on Wednesday, weekly initial jobless claims on Thursday, and finally an update on the US unemployment rate on Friday. Aside from the ADP report, which will reflect December data, the rest of the data released will be up to date as of January. Last week, the Fed left rates steady, with Jerome Powell indicating that the labor market is showing signs of stabilization. That said, unemployment is expected to also hold steady at 4.4%, while a slight uptick in nonfarm payrolls is likely. While there is still room for improvement, a stronger start to 2026 compared to the end of 2025 is something to be optimistic about.
Across the globe, markets and political tension made for a memorable January. The MSCI ACWI, which tracks global equities across the US, developed countries outside the US, and emerging markets, recorded its broadest participation in over 30 years with 85% of stocks finishing at new monthly highs. However, while most countries appear to be gaining strength this year, the dollar continues to sink. A weaker dollar can act as both a headwind and a tailwind, depending on the perspective you take. From an investor’s point of view, a weaker dollar translates into less growth for US assets. From a business owner’s standpoint, a cheaper dollar can improve global demand, as foreign buyers are able to purchase US goods at relatively lower prices. So far this year, it’s meant another month of outperformance by foreign equities.
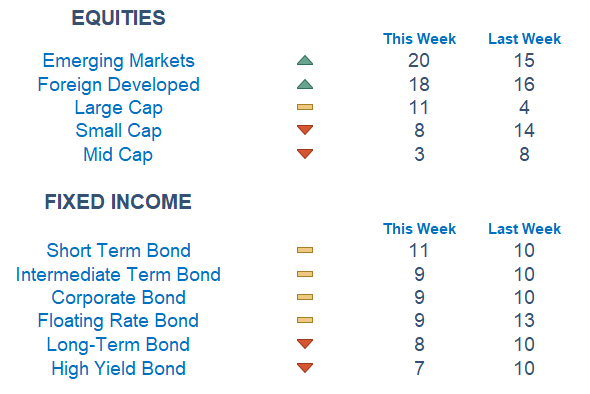
Our Newton model further supports an emphasis on markets overseas. Emerging markets continue to flourish, with foreign developed not far behind. Unfortunately, most other areas appear less attractive, with momentum falling across the board. Healthcare enjoyed a strong run, but we are now seeing a fairly sharp pullback. We’ve also seen a shift towards value this year, with large-cap growth beginning to regain some strength.
Economic Releases This Week
Monday: ISM Manufacturing
Tuesday: ISM Services, Job Openings and Labor Turnover Survey
Wednesday: ADP Employment
Thursday: Initial Jobless Claims
Friday: US Jobs Report
Stories to Start the Week
Here’s what to know about the partial government shutdown and its impact
Bitcoin Break Below $80,000 Signals New Crisis of Confidence
Trump thinks a weaker dollar is great for America. Is he right?
A slew of new CEO appointments across the retail industry in 2026

Our Newton model attempts to determine the highest probability of future price direction by using advanced algorithmic and high-order mathematical techniques onthe current market environment to identify trends in underlying security prices. The Newton model scores securities over multiple time periods on a scale of 0-20 with 0 being the worst and 20 being the best possible score.
Trend & level both matter. For example, a name that moves from an 18 to a 16 would signal a strong level yet slight exhaustion in the trend.

Technical trading models are mathematically driven based upon historical data and trends of domestic and foreign market trading activity, including various industry and sector trading statistics within such markets. Technical trading models, through mathematical algorithms, attempt to identify when markets are likely to increase or decrease and identify appropriate entry and exit points. The primary risk of technical trading models is that historical trends and past performance cannot predict future trends and there is no assurance that the mathematical algorithms employed are designed properly, updated with new data, and can accurately predict future market, industry and sector performance.