
MARKET COMMENTARY
Markets finally caught some relief at the end of last week, moving upward on Friday. It was also a big day in terms of tariffs, with the Supreme Court ruling that Trump’s tariffs under the International Emergency Economic Powers Act were unconstitutional. While this means businesses can file for refunds, it will be up to the administration to determine how quickly these refunds come to fruition, which isn’t looking like a quick process. Following the official ruling on IEEPA tariffs, Trump announced new tariffs under Section 122, which allows the president to impose tariffs of up to 15% for up to 150 days to address trade deficits. The tariff discussion is back in full swing, and we’ll be watching closely to see how corporations and markets react.
It’s not a super busy week for economic data. We’ll be keeping an eye on consumer confidence tomorrow, weekly initial jobless claims on Thursday and an updated Producer Price Index for January on Friday. We’re also rounding up earnings this week, hearing from tech names including NVIDIA, Salesforce and CoreWeave, along with consumer firms such as Home Depot, TJX and Lowe’s. Through Q4 2025 earnings season, most companies beat forecasts, but still faced tough expectations from investors, who have been more focused on future guidance rather than past performance. Future earnings expectations are reaching record highs, although investors remain skeptical as returns on the significant capital expenditures being promised are years away. Fortunately, corporations beyond big tech are contributing to a successful season, with earnings improving across industrials, communication services, and financials sector. That said, our market leader, NVIDIA, which accounts for nearly 8% of the S&P 500 market cap and has had a choppy year with little improvement in its stock price, should provide insight into the lagging tech and AI sector.
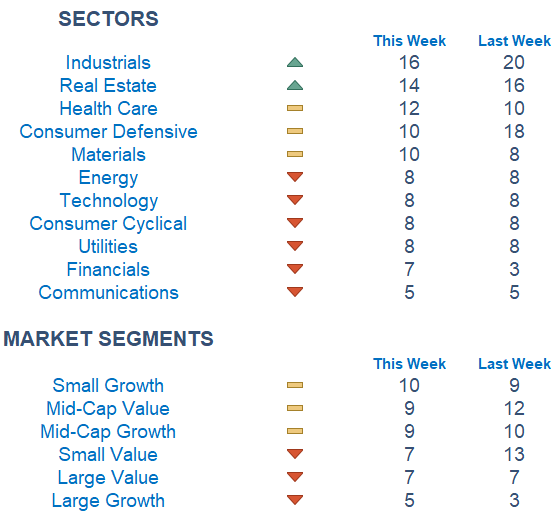
The technical side of the equation still looks relatively weak, with poor momentum across most major indexes. As we’ve mentioned, we’ve seen a great rotation away from growth and into value. Sectors showing renewed strength include materials, energy, industrials, and consumer staples. Recently, real estate has also joined the group, though we’ll continue to monitor how that progresses. Healthcare, which rallied at the end of 2025, has stalled out, along with tech, which continues to show weaker signs each week. Alongside the rotation, we’ve seen institutional investors reducing their equity exposure, reaching levels last seen in early October of last year. In efforts to move out of big tech, investors must find alternative places to allocate capital, which can be challenging given tech’s large market weight, while leading sectors such as energy and industrials don’t carry as much market cap.
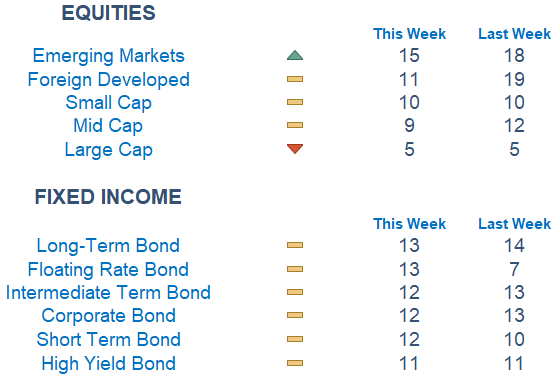
Our Newton model signals weak performance across the board, with few areas looking attractive, as expected given the poor momentum over the past several weeks. The story outside the US remains prettier, but foreign developed have pulled back compared to last week. Fixed income continues to look stable and industrials remain the most favorable sector. Overall, market segments are less than ideal at the moment, with small-cap growth appearing to be the most promising.
Economic Releases This Week
Monday: None
Tuesday: Consumer Confidence
Wednesday: None
Thursday: Initial Jobless Claims
Friday: Producer Price Index
Stories to Start the Week
Sam Altman says Elon Musk’s idea of putting data centers in space is ‘ridiculous’
Europe hits back at ‘pure tariff chaos’ from the US, warning trade deals are at risk
The hockey goalie who saved Team USA and won America a gold medal
Mexico takes on cartels as killing of drug kingpin sparks violence

Our Newton model attempts to determine the highest probability of future price direction by using advanced algorithmic and high-order mathematical techniques onthe current market environment to identify trends in underlying security prices. The Newton model scores securities over multiple time periods on a scale of 0-20 with 0 being the worst and 20 being the best possible score.
Trend & level both matter. For example, a name that moves from an 18 to a 16 would signal a strong level yet slight exhaustion in the trend.
Technical trading models are mathematically driven based upon historical data and trends of domestic and foreign market trading activity, including various industry and sector trading statistics within such markets. Technical trading models, through mathematical algorithms, attempt to identify when markets are likely to increase or decrease and identify appropriate entry and exit points. The primary risk of technical trading models is that historical trends and past performance cannot predict future trends and there is no assurance that the mathematical algorithms employed are designed properly, updated with new data, and can accurately predict future market, industry and sector performance.
Disclousure:
Investing involves risk, including the possible loss of principal and fluctuation of value. Past performance is no guarantee of future results.
This newsletter is not intended to be relied upon as forecast, research or investment advice, and is not a recommendation, offer or solicitation to buy or sell any securities or to adopt any investment strategy. The opinions expressed are as of the date noted and may change as subsequent conditions vary. The information and opinions contained in this letter are derived from proprietary and nonproprietary sources deemed by Waterloo Capital to be reliable. The letter may contain “forward-looking” information that is not purely historical in nature. Such information may include, among other things, projection, and forecasts. There is no guarantee that any forecast made will materialize. Reliance upon information in this letter is at sole discretion of the reader. Please consult with a Waterloo Capital financial advisor to ensure that any contemplated transaction in any securities or investment strategy mentioned in this newsletter aligns with your overall investment goals, objectives and tolerance for risk. Additional information about Waterloo Capital is available in its current disclosure documents, Form ADV, Form ADV Part 2A Brochure, and Client Relationship Summary report which are accessible online via the SEC’s investment Adviser Public Disclosure (IAPD) database at www.adviserinfo.sec.gov, using SEC # 133705. Waterloo Capital is neither an attorney nor an accountant, and no portion of this content should be interpreted as legal, accounting or tax advice.