
MARKET COMMENTARY
Markets were mixed to begin the week, as investors digested news regarding Nvidia and AMD’s deal to pay the federal government 15% of their sales of AI chips to China and the latest corporate earnings. All eyes were on U.S.-China relations this morning, until the trade truce with China was extended by 90 days. Intel CEO Lip-Bu Tan is set to visit the White House amidst President Trump’s demands for him to step down over alleged ties to the Chinese Communist Party.
Tuesday will be a big day for the market and the Federal Reserve, as CPI data will be released, providing insight into how President Trump’s tariff policies are affecting price pressures. Economists are forecasting a 2.8% increase in the 12 months through July. That would be a slight increase from June’s 2.7% figure. Core CPI is seen accelerating to 3.1% up from a 2.9% rate in June, excluding volatile food and energy costs. This will be the first major data release from the Bureau of Labor Statistics since President Trump fired leader Erika McEntarfer over claims of faulty July nonfarm payroll data. If CPI data comes in hotter than expected, it could delay Fed rate cuts, potentially triggering a pullback in U.S. equities. The CPI release will be the last data point the Fed before the Fed’s September meeting, with mounting pressure for the institution to cut rates.
Beyond Tuesday’s CPI release and a packed earnings calendar, investors will be watching several other key economic indicators this week that could sway market sentiment. On Thursday, we get latest Producer Price Index (PPI) data, offering a look at inflation pressures from the business side. Economists expect a modest uptick, which could reinforce concerns about sticky inflation. Also on deck is retail sales data, due Wednesday, which will provide insight into consumer spending trends amid rising prices and interest rate uncertainty. Meanwhile, initial jobless claims will be released Thursday, with markets looking for signs of coiling in the labor market following last month’s controversial nonfarm payroll report. Together, these releases will help shape expectations for the Fed’s next move and could add volatility to an already sensitive market landscape.
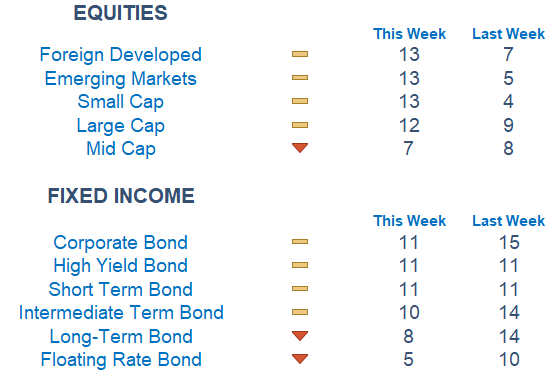
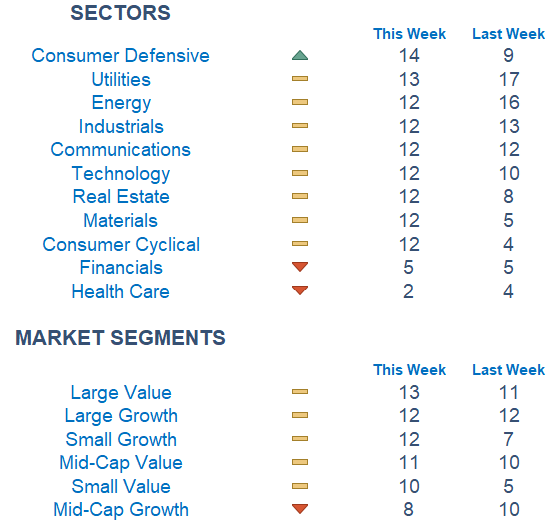
Newton Model Insights:
This week’s Newton model scores show a notable shift in sentiment across asset classes. In equities, Foreign Developed, Emerging Markets, and Small Cap all surged from deeply bearish scores last week (7, 5 and 4, respectively) to neutral territory at 13. Mid Cap dipped slightly from 8 to 7, remaining in bearish territory, while Large Cap rose 3 points. In fixed income, Corporate Bonds fell from 15 to 11, indicating weakening momentum, while High Yield Bonds remained unchanged. Among sectors, Consumer Defensive jumped from 9 to 14, entering bullish territory and signaling a potential rotation into more stable, recession-resistant names.These shifts suggest a cautious but broadening appetite for risk, with investors selectively rotating into areas showing improving technical strength.
Economic Releases This Week
Monday: None scheduled
Tuesday: Monthly U.S. federal budget, Core CPI, NFIB optimism index
Wednesday: Chicago fed president Austan Goolsbee speaks, Atlanta fed president Raphael Bostic speaks
Thursday: Initial jobless claims, Core PPI, Producer price index
Friday: U.S. retail sales, Import price index, Industrial production, Capacity utilization, Business inventories, Consumer sentiment (prelim)
Stories to Start the Week
Trump to deploy national guard to D.C., take over city’s police department
Nvidia and AMD to pay 15% of China chip sale revenues to US government
The engineering marvel that China hopes will help wean it off foreign energy
Ford announces $2 billion investment in Louisville assembly plant for cheap EVs
DOJ request to release Ghislaine Maxwell grand jury materials denied by judge

Our Newton model attempts to determine the highest probability of future price direction by using advanced algorithmic and high-order mathematical techniques on the current market environment to identify trends in underlying security prices. The Newton model scores securities over multiple time periods on a scale of 0-20 with 0 being the worst and 20 being the best possible score.
Trend & level both matter. For example, a name that moves from an 18 to a 16 would signal a strong level yet slight exhaustion in the trend.
Technical trading models are mathematically driven based upon historical data and trends of domestic and foreign market trading activity, including various industry and sector trading statistics within such markets. Technical trading models, through mathematical algorithms, attempt to identify when markets are likely to increase or decrease and identify appropriate entry and exit points. The primary risk of technical trading models is that historical trends and past performance cannot predict future trends and there is no assurance that the mathematical algorithms employed are designed properly, updated with new data, and can accurately predict future market, industry and sector performance.