
This Week on Wall Street – Week of October 13th
Today marks the third week of the government shutdown, with Washington still in gridlock over a resolution.
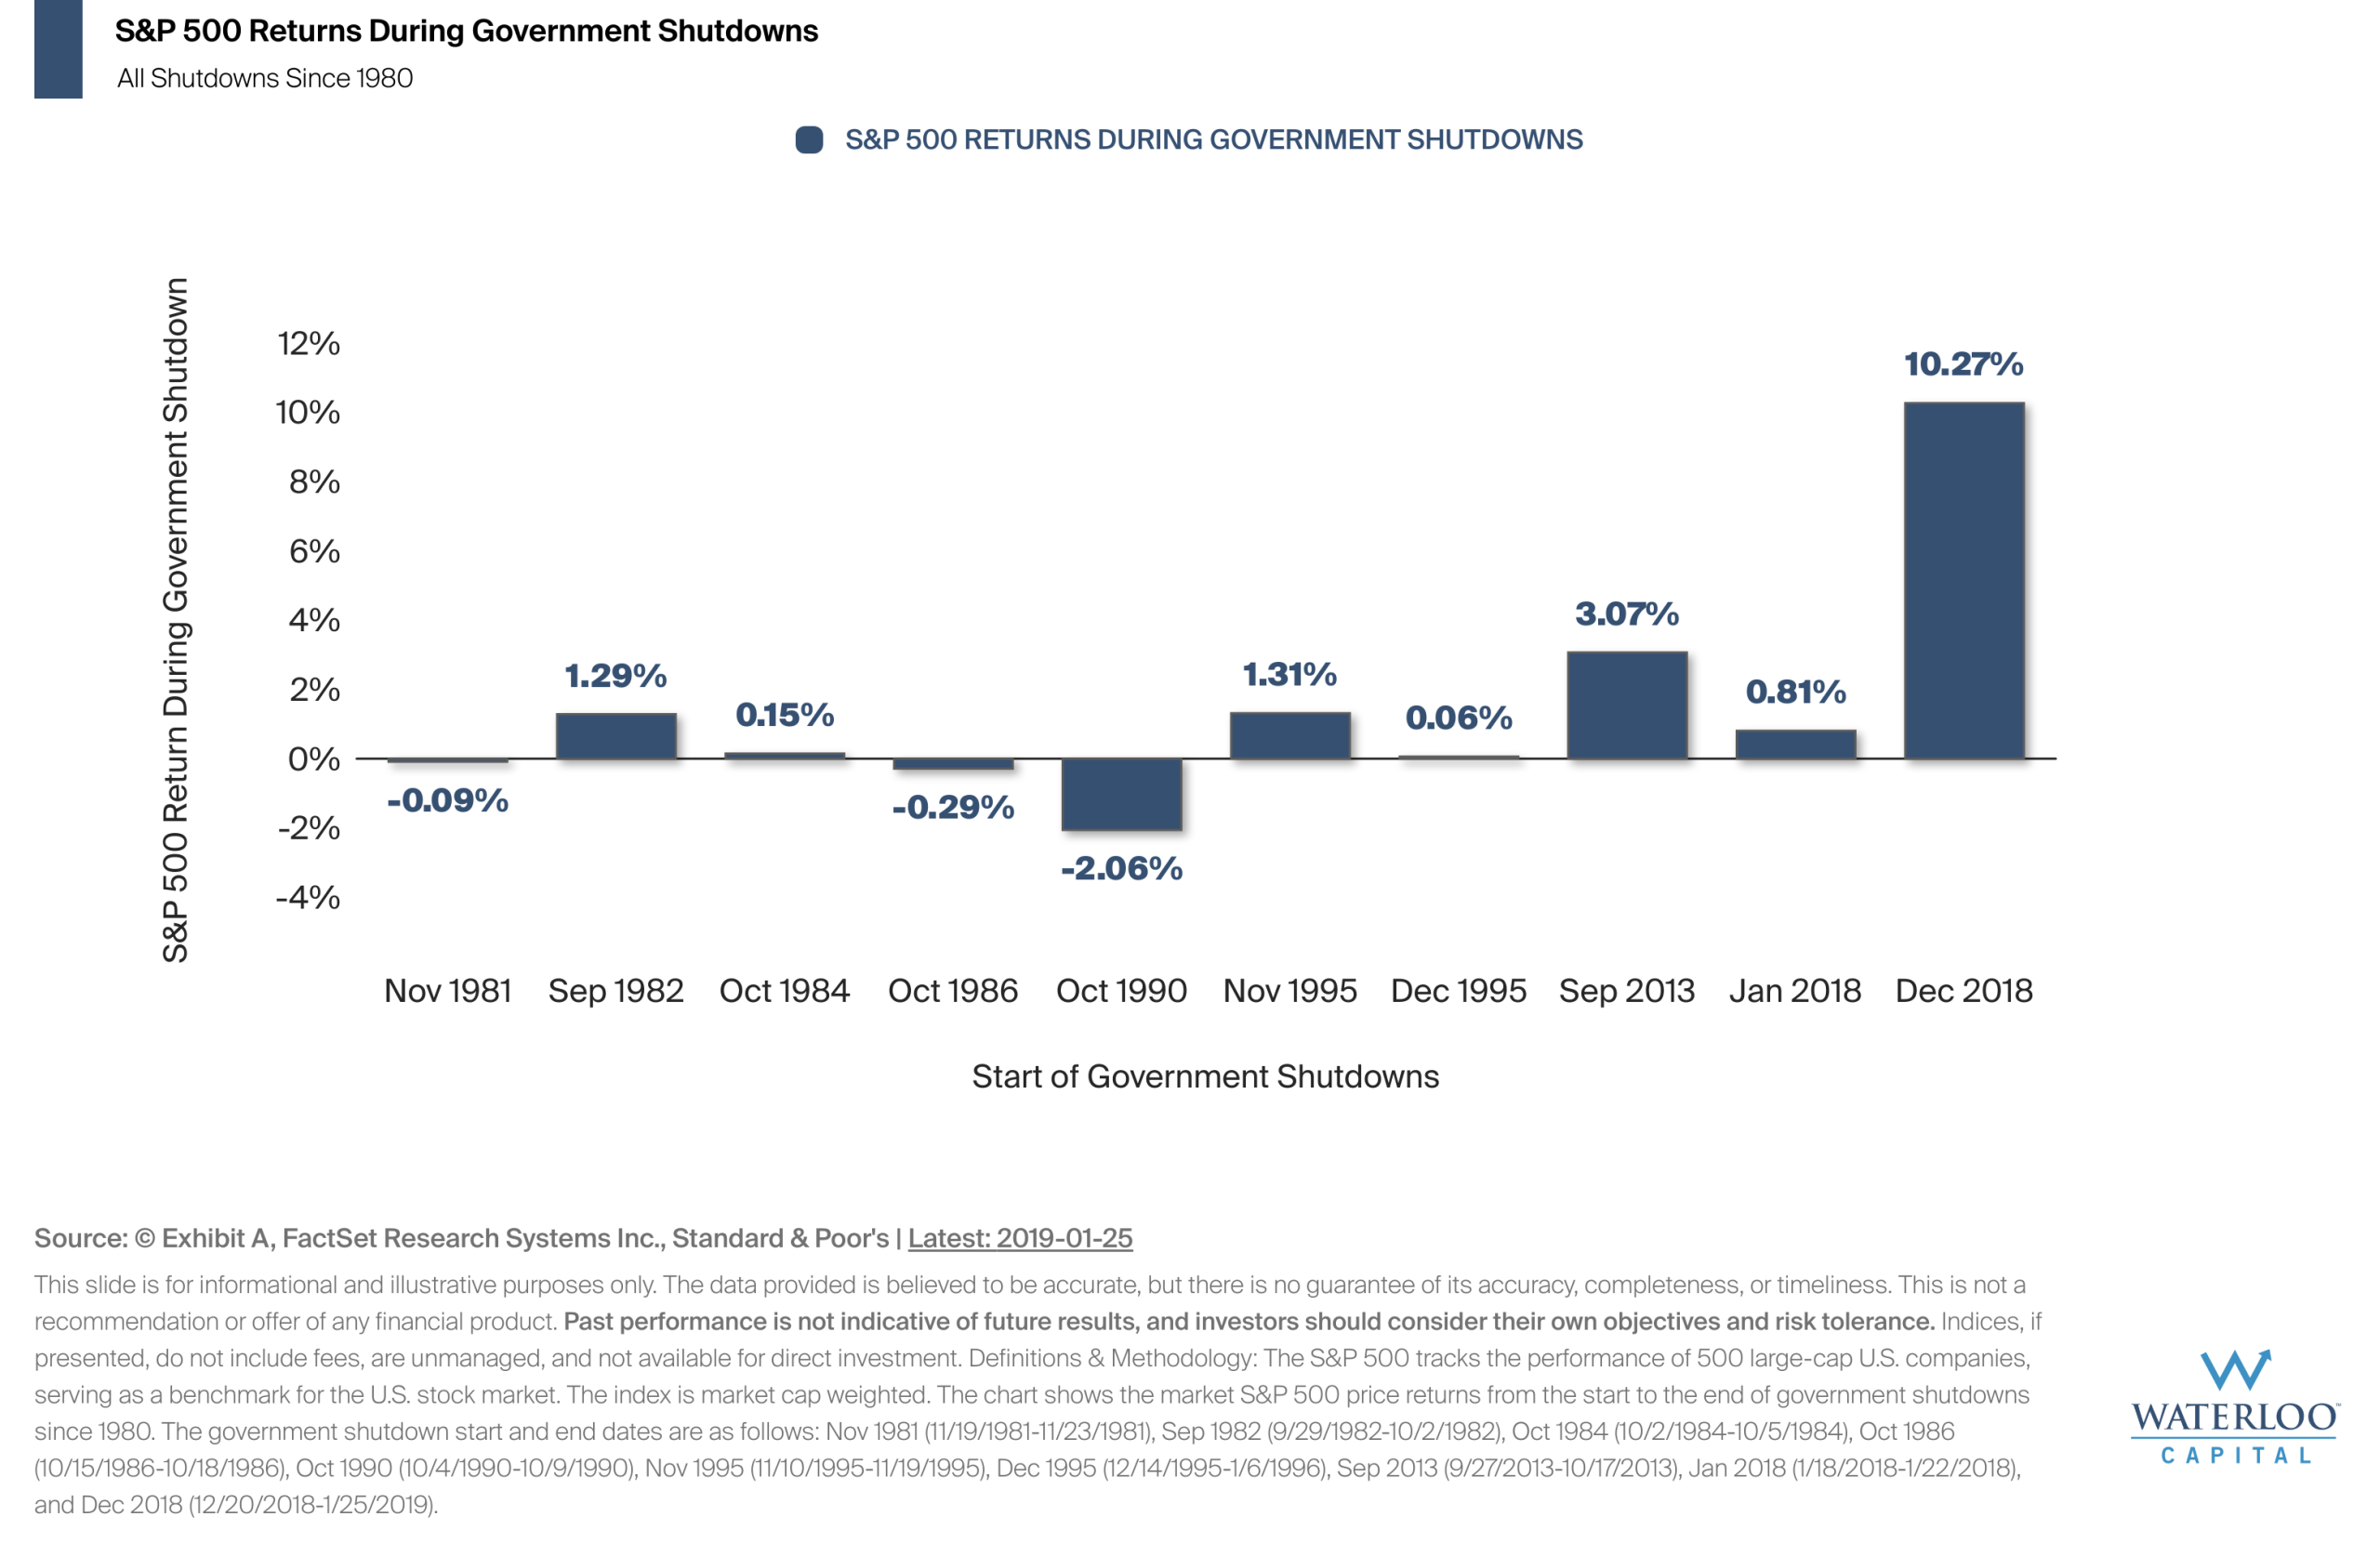
Chart Of the Week – How do Equities Perform During Government Shutdowns?
This chart tracks how the S&P 500 performed during past U.S. government shutdowns.

Last Week on Wall Street – October 11th, 2025
S&P 500: -2.43% DOW: -2.73% NASDAQ:-2.53% 10-YR Yield: 4.06%
Last Week on Wall Street – October 4th, 2025
S&P 500: 1.09% DOW: 1.10% NASDAQ:1.32% 10-YR Yield: 4.12%
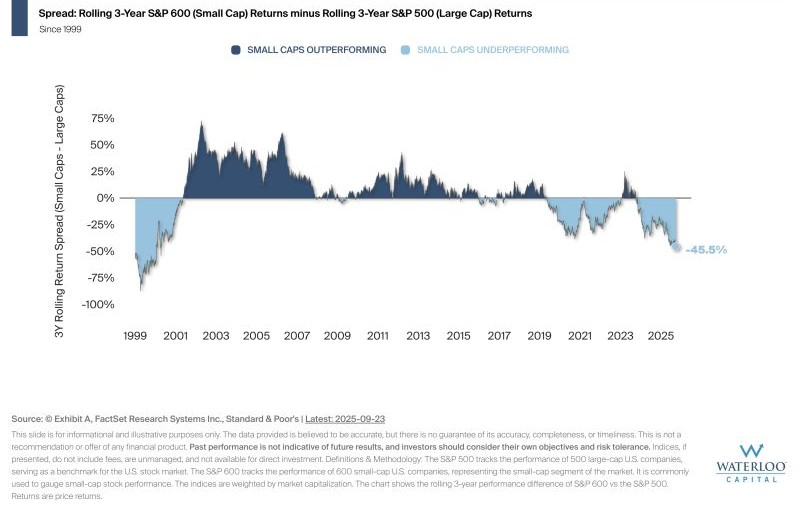
Chart Of the Week – Measuring Cycles of Small Cap vs Large Cap Performance
The chart illustrates the rolling 3-year performance difference between small-cap stocks (S&P 600) and large-cap stocks (S&P[…]
This Week on Wall Street – Week of September 29th
Jobs week is here and investors will get a flood of employment data, culminating Friday with the BLS’s[…]
Last Week on Wall Street – September 27th, 2025
S&P 500: -0.31% DOW: -0.15% NASDAQ:-0.65% 10-YR Yield: 4.17%
Last Week on Wall Street – September 27th, 2025
S&P 500: -0.31% DOW: -0.15% NASDAQ:-0.65% 10-YR Yield: 4.17%
Last Week on Wall Street – September 20th, 2025
S&P 500: 1.27% DOW: 1.07% NASDAQ:2.21% 10-YR Yield: 4.13%
Let’s Connect
©2025. Advisory services offered through Waterloo Capital, LP, An SEC Registered Investment Advisor.