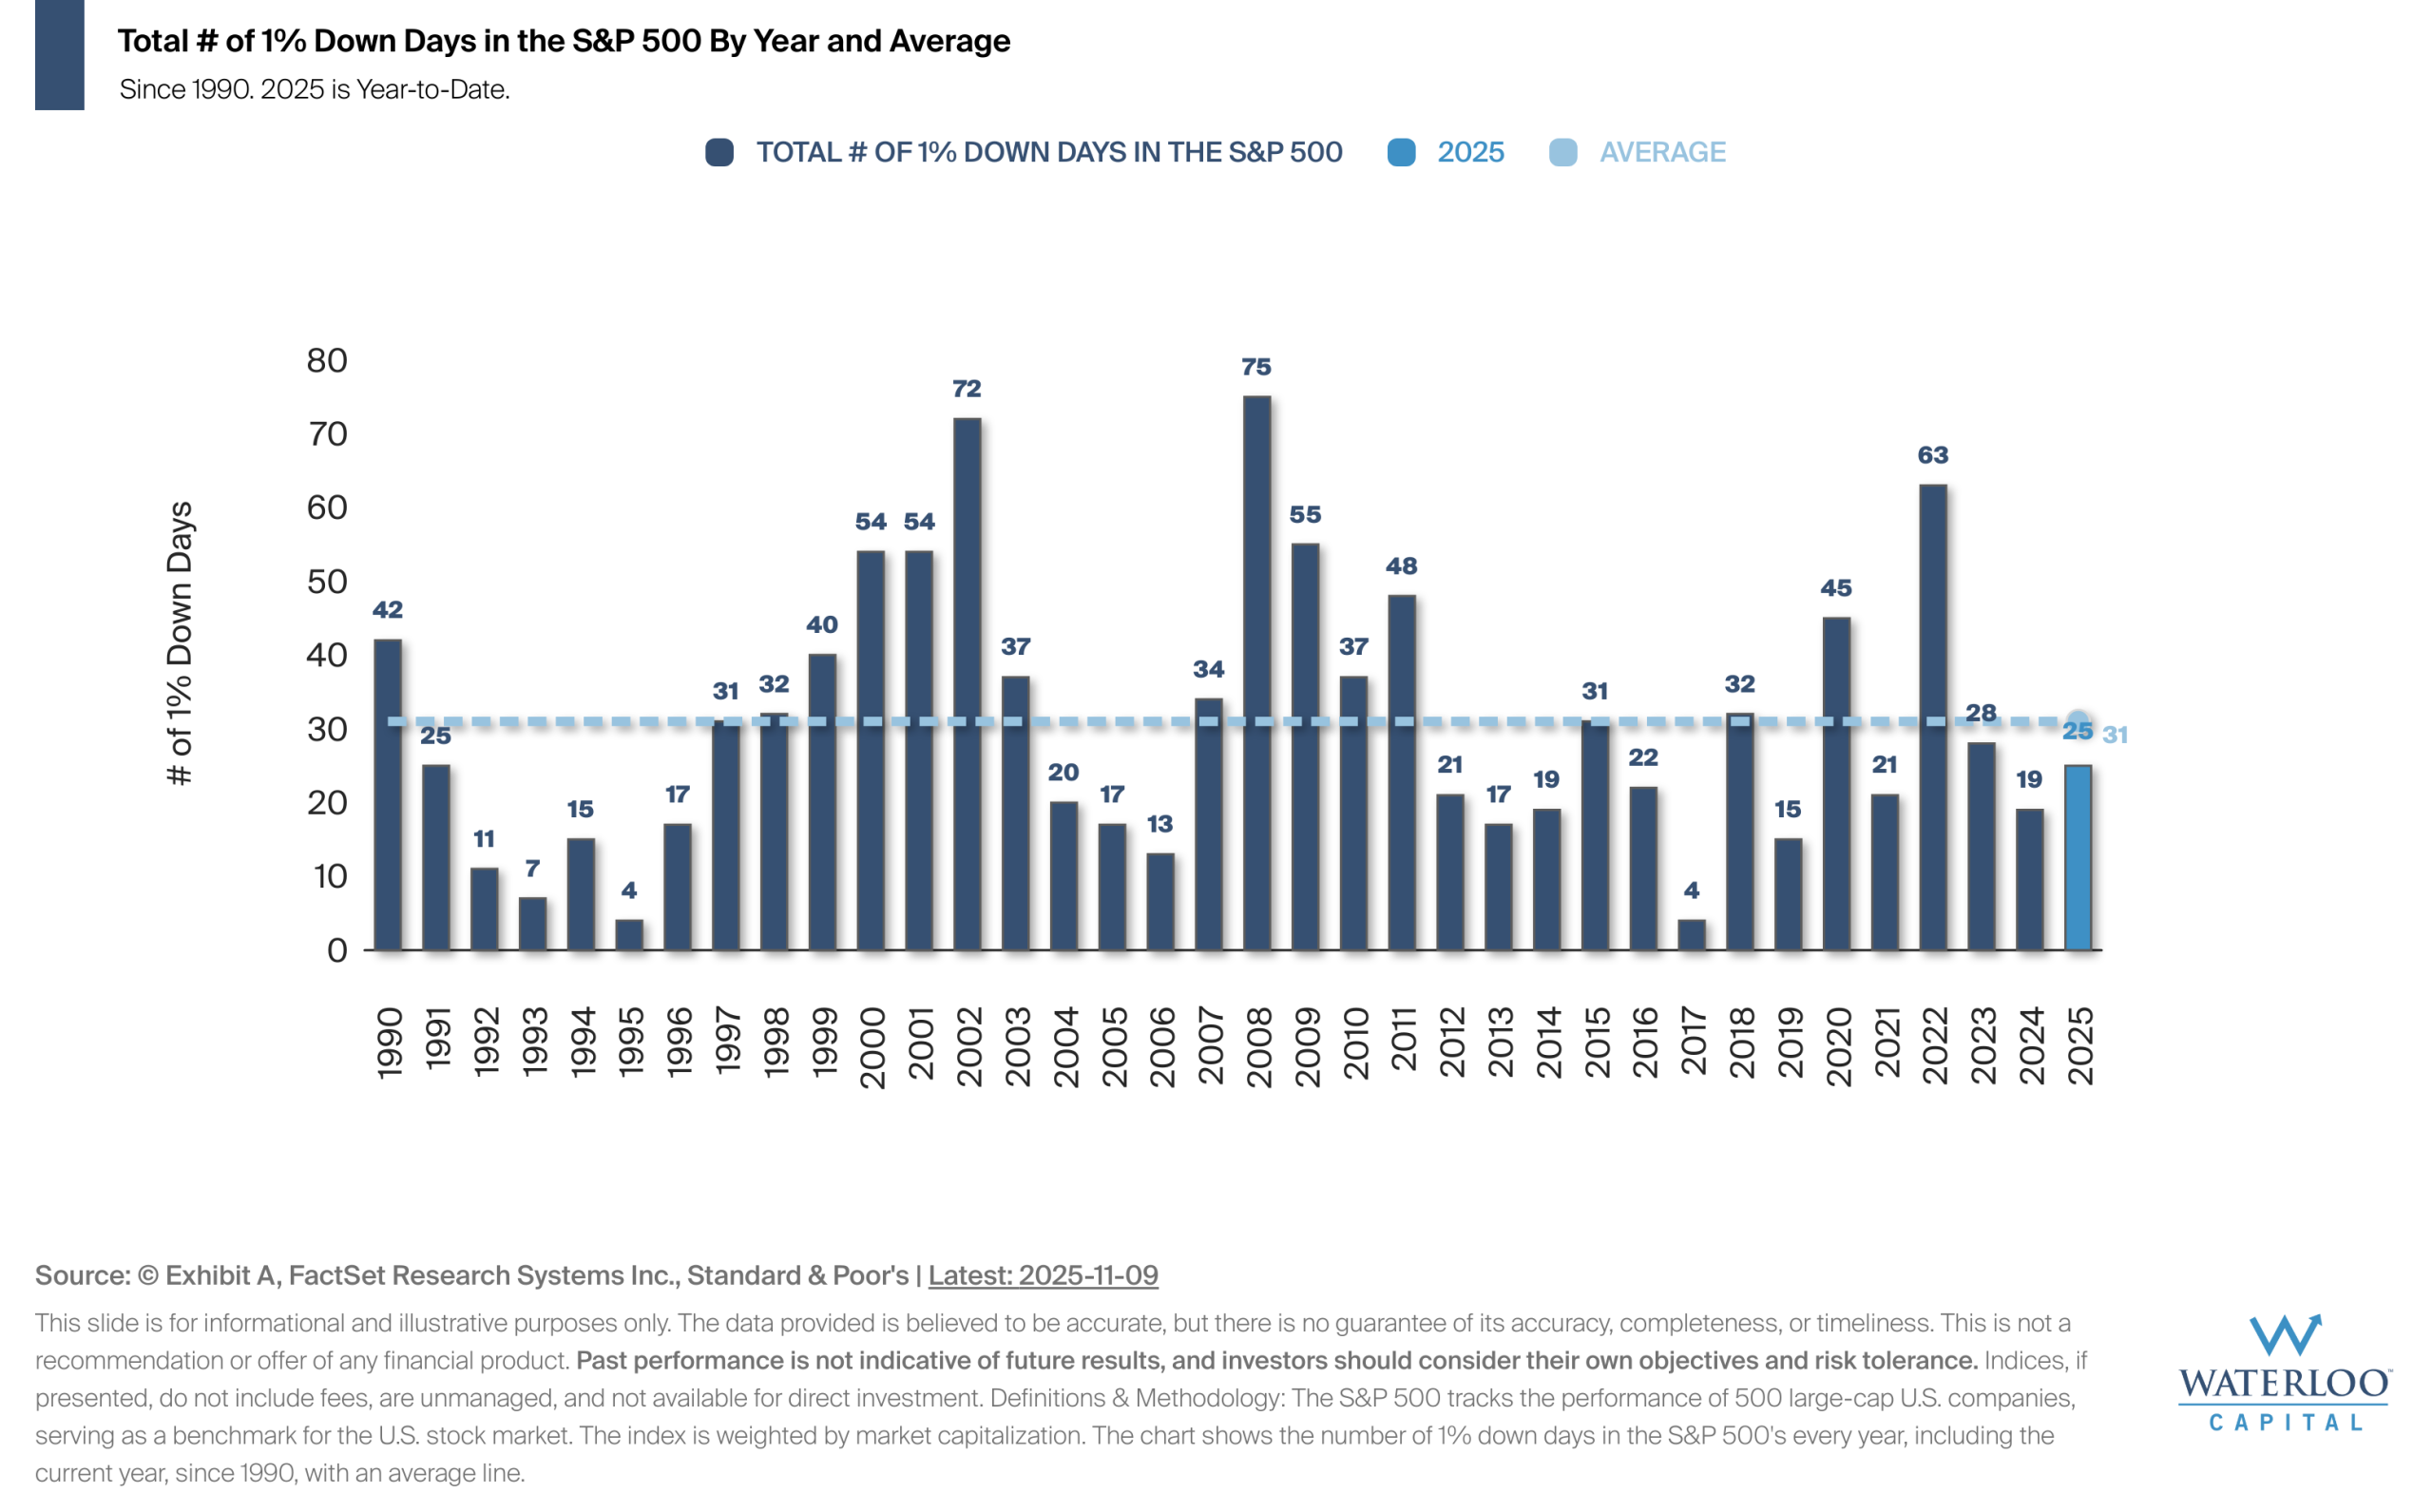
Chart Of the Week – It’s Historically Normal For Large Down Days To Happen
The chart shows that large market declines of 1% or more happen regularly — on average, there[…]

This Week on Wall Street – Week of November 10th
Last week witnessed a real turn of events as the S&P 500 recorded its largest drop since[…]

Last Week on Wall Street – November 8th, 2025
S&P 500: -1.63% DOW: -1.21% NASDAQ:-3.04% 10-YR Yield: 4.09%
This Week on Wall Street – Week of November 3rd
Markets roared even higher last week following another interest rate cut and more talk on the future[…]
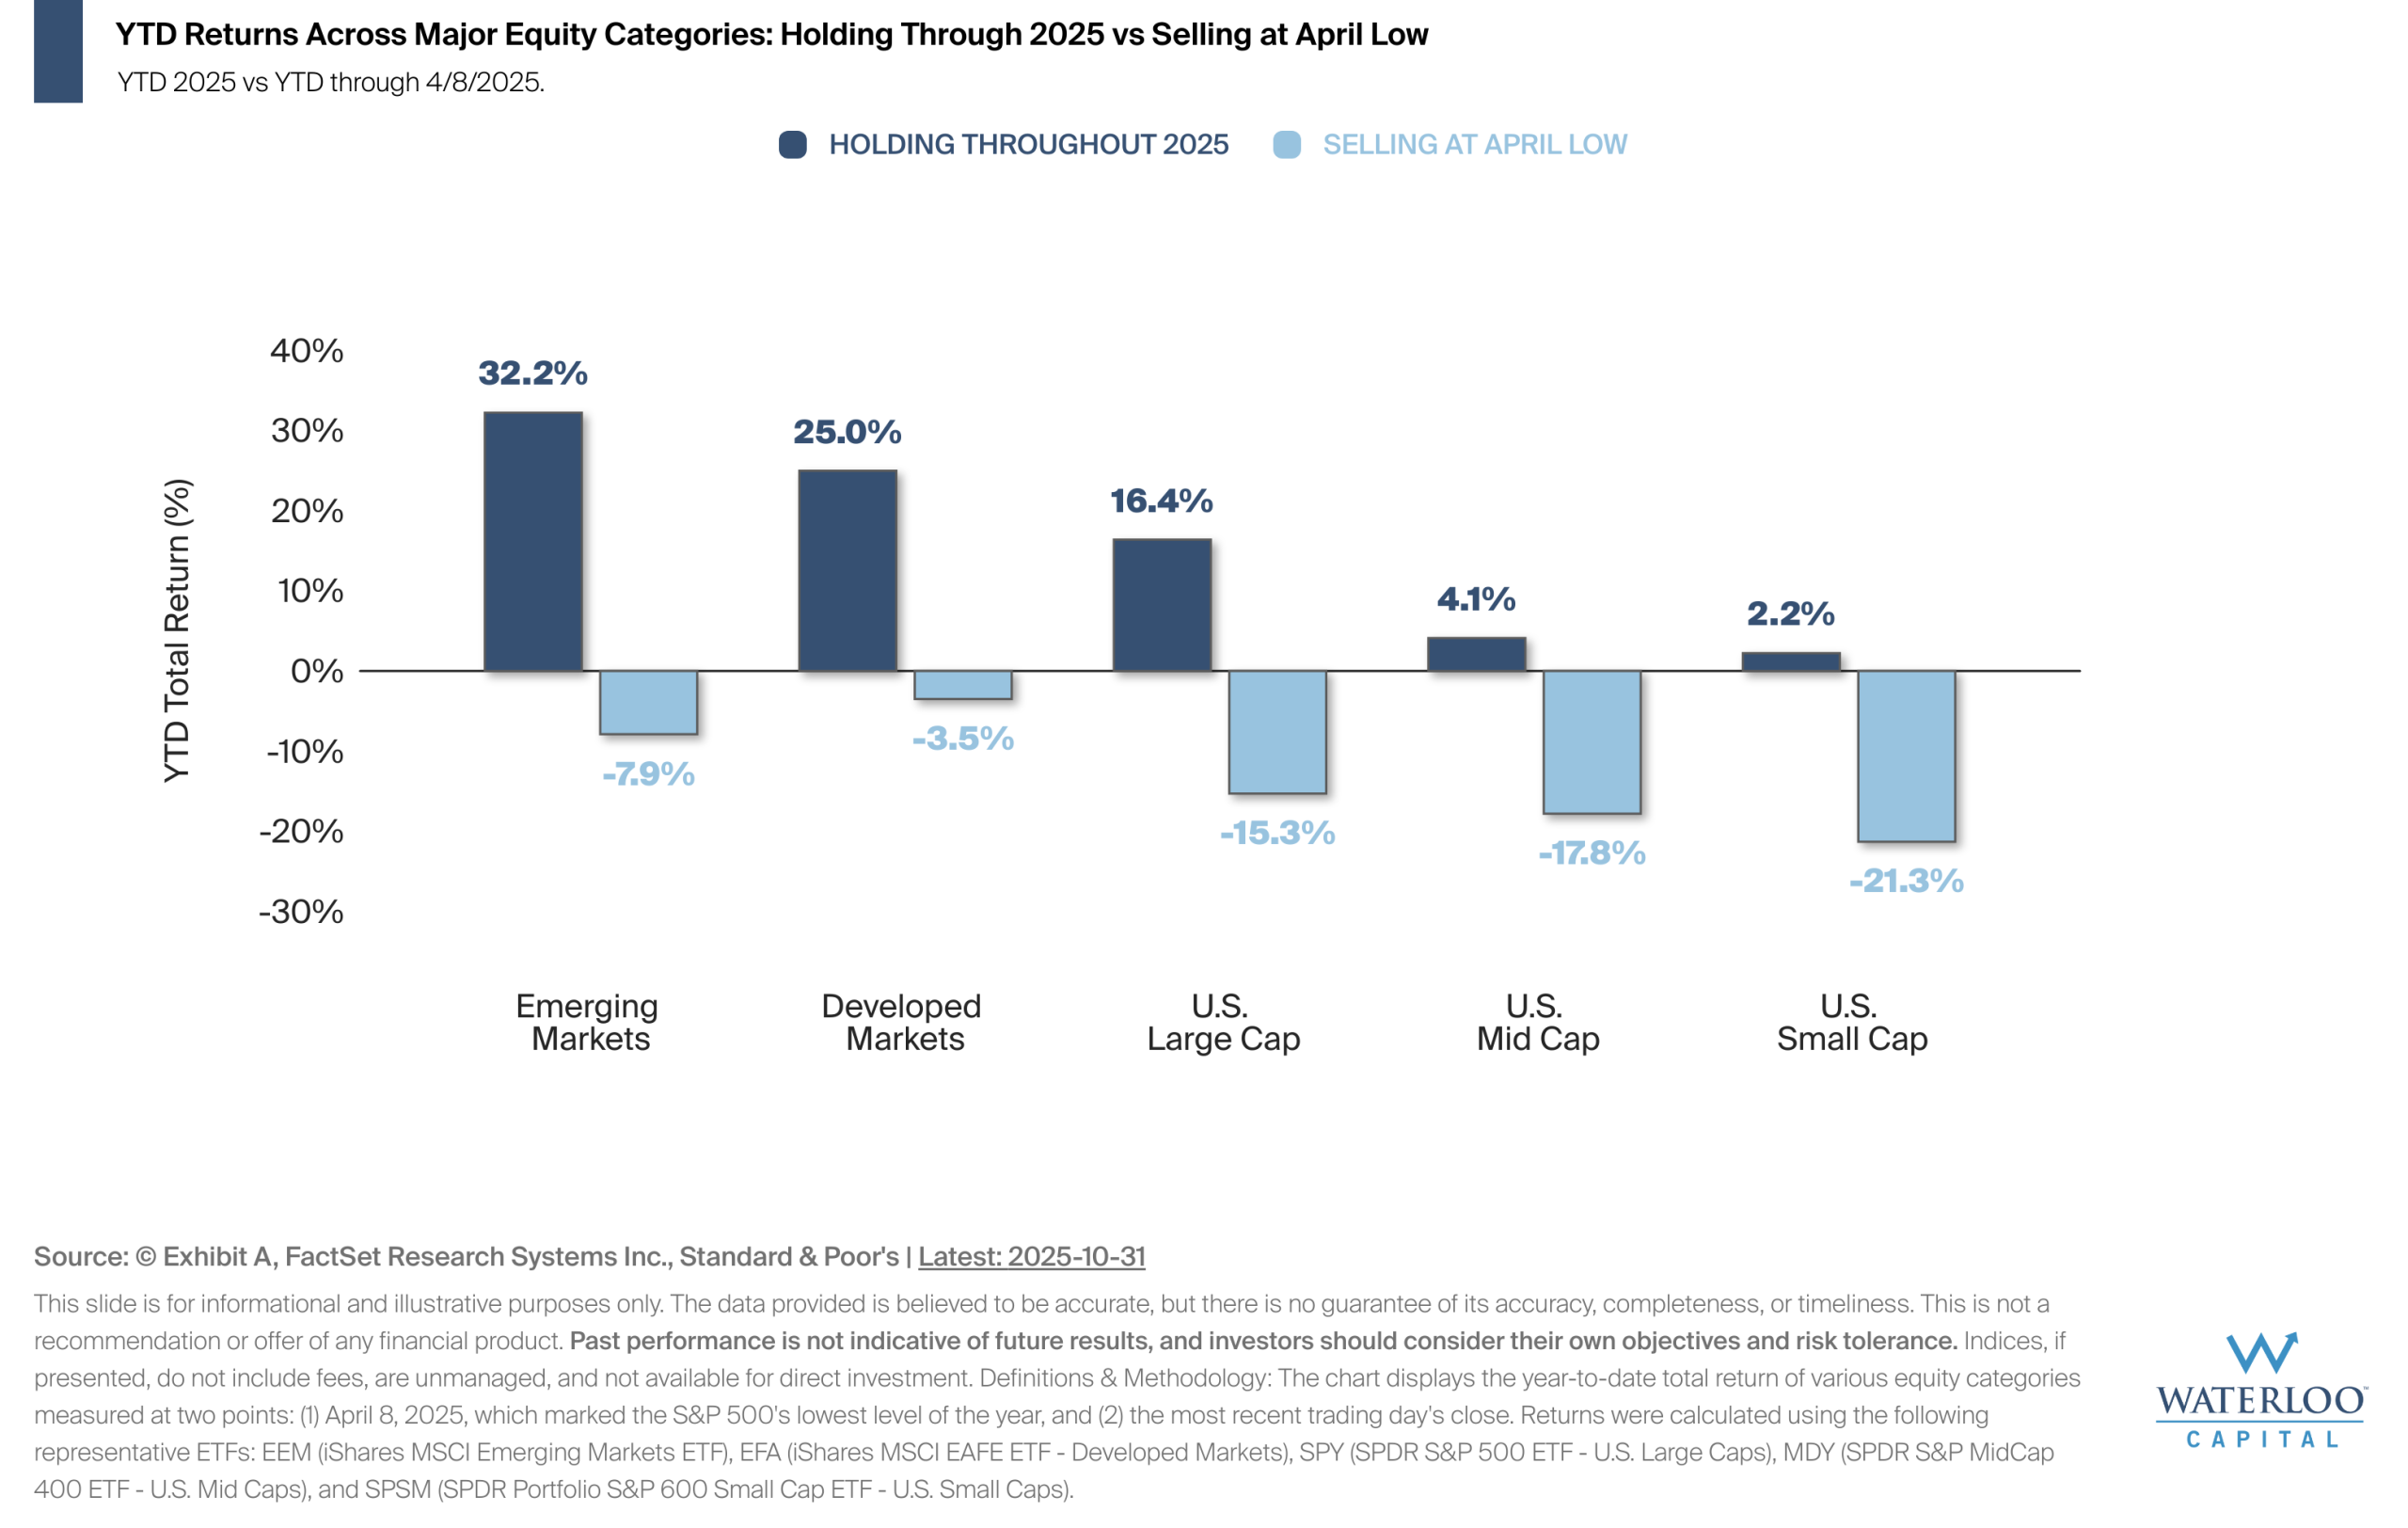
Chart Of the Week – Staying the Course Has Worked Again
The chart compares year-to-date returns across major equity categories for two scenarios: investors who held throughout 2025[…]
Last Week on Wall Street – November 1st, 2025
S&P 500: 0.71% DOW: 0.75% NASDAQ:2.24% 10-YR Yield: 4.10%
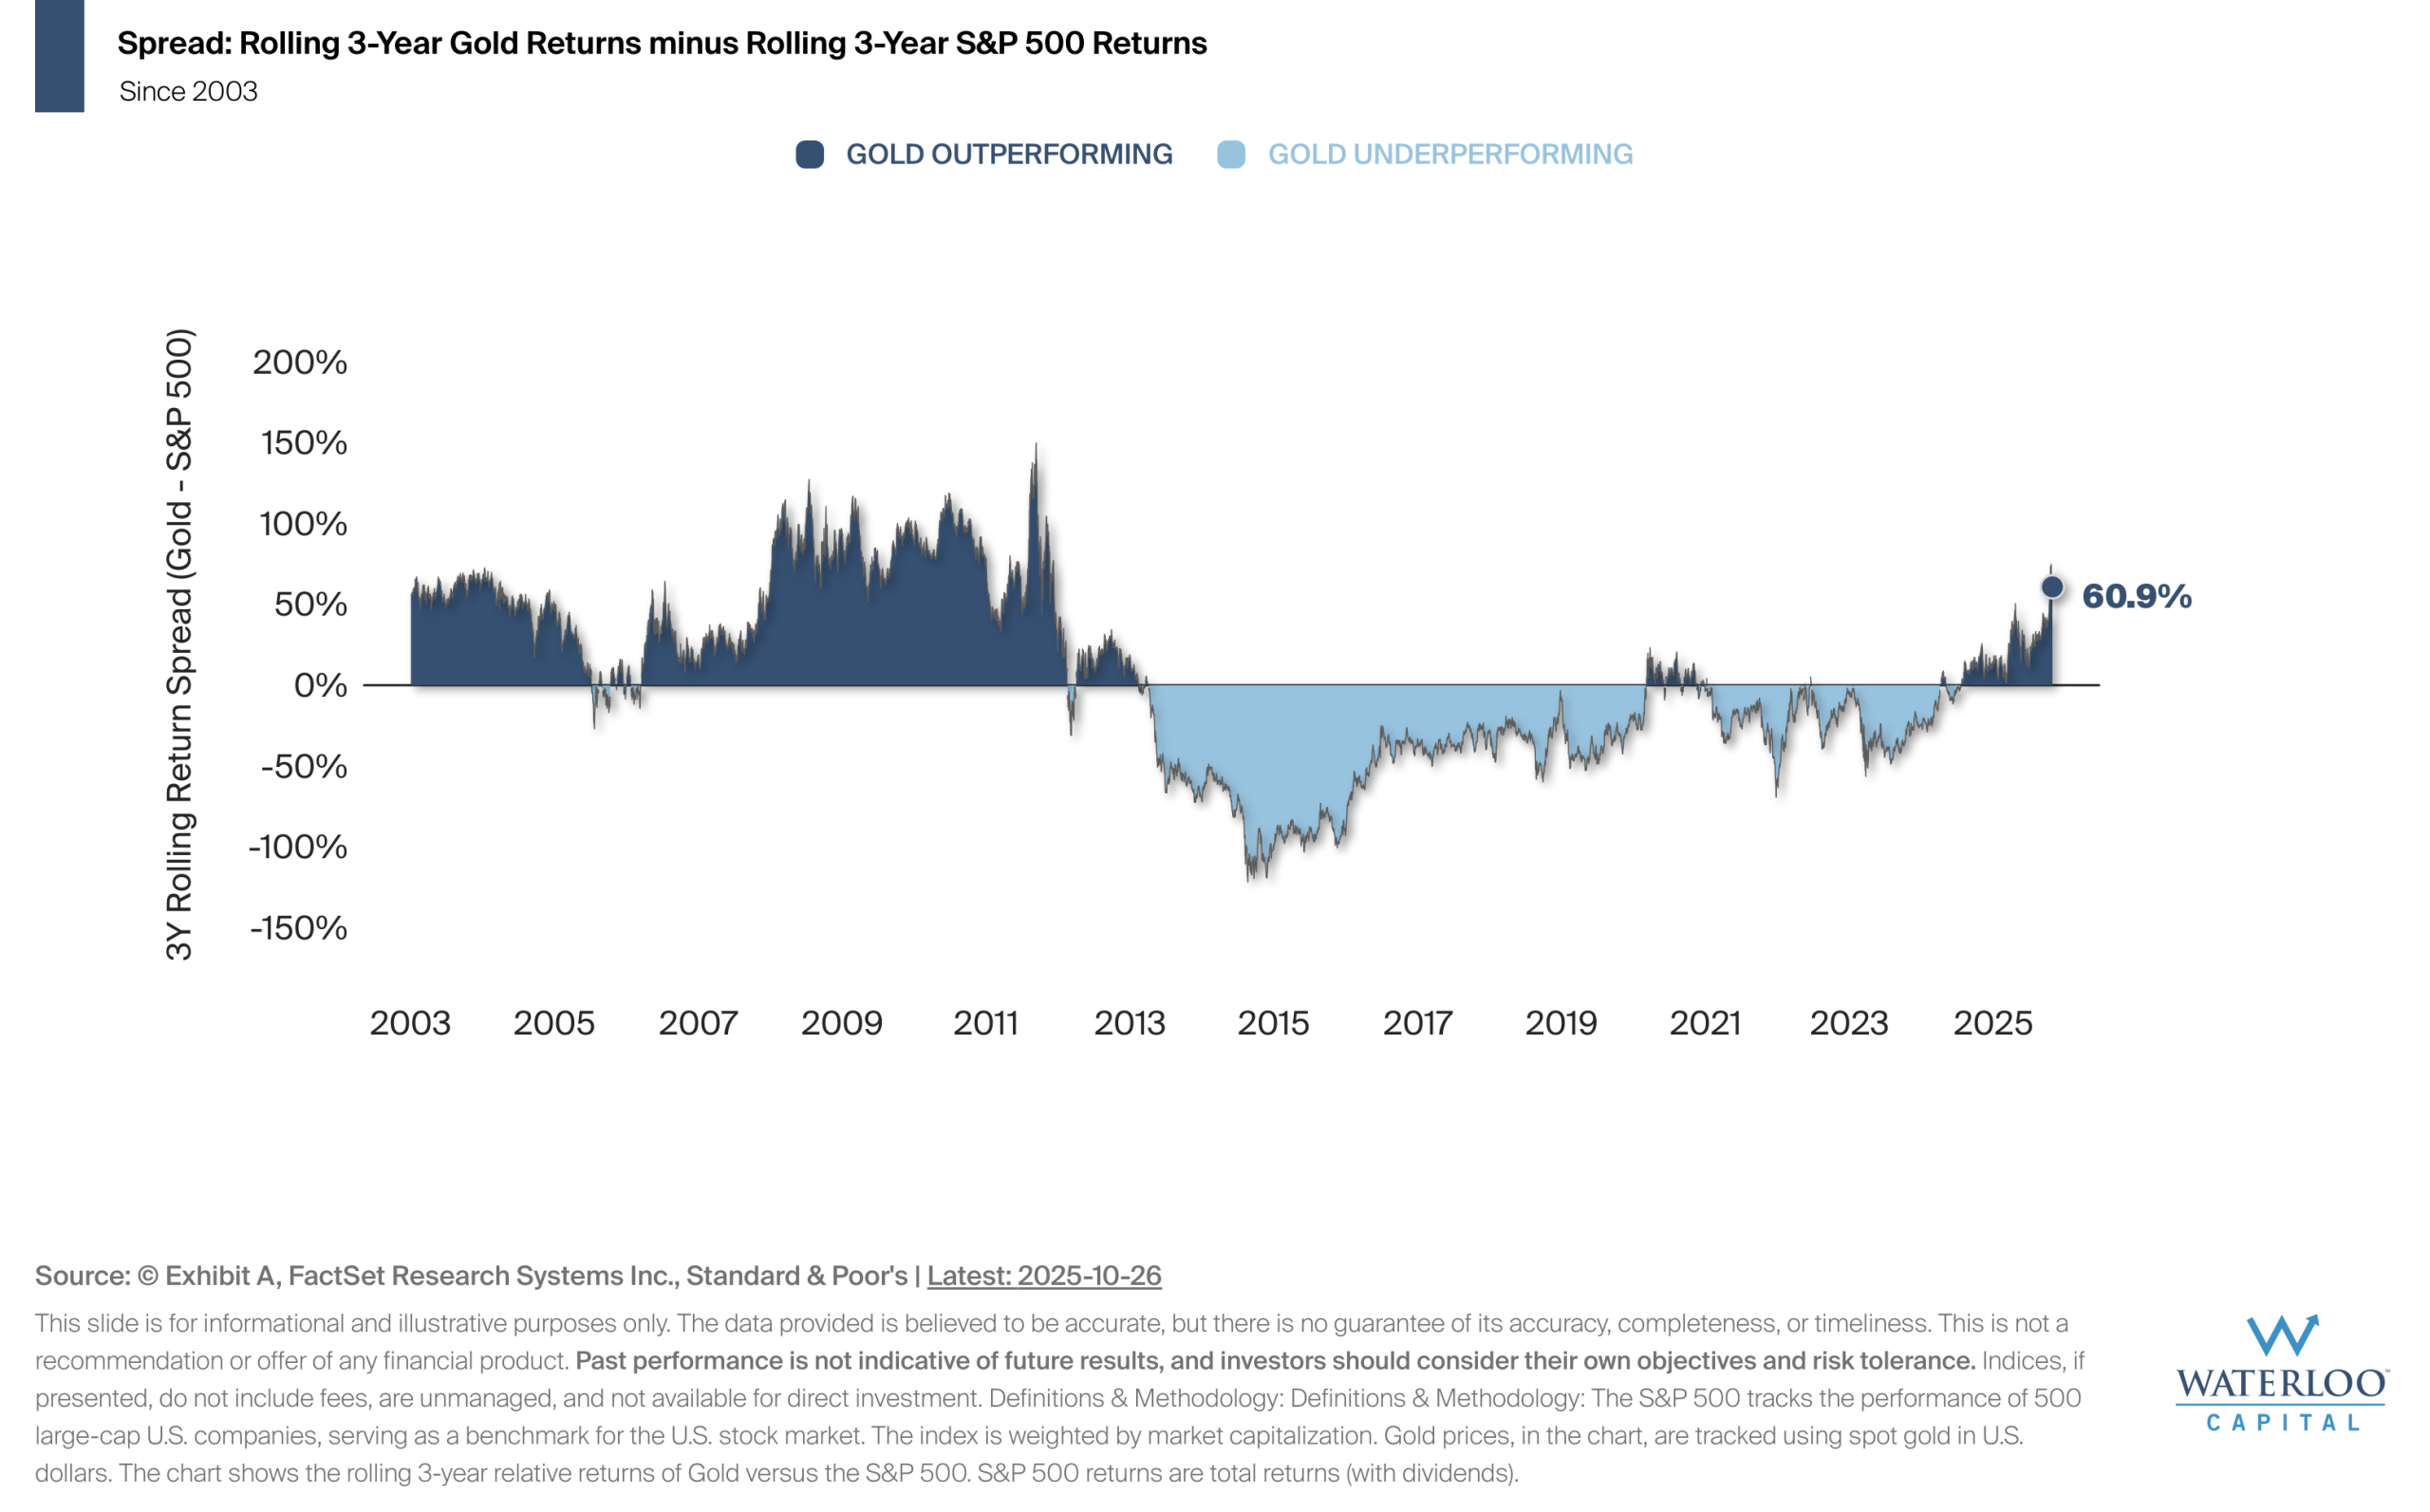
Chart Of the Week – Gold Outperforms in Cycles
The chart illustrates the rolling 3-year performance difference between gold and the S&P 500, showing how leadership[…]

This Week on Wall Street – Week of October 27th
In case you haven’t been paying attention, there’s a lot happening across markets and this week's developments[…]
Last Week on Wall Street – October 25th, 2025
S&P 500: 1.92% DOW: 2.20% NASDAQ:2.31% 10-YR Yield: 4.00%
Last Week on Wall Street – October 18th, 2025
S&P 500: 1.70% DOW: 1.56% NASDAQ:2.14% 10-YR Yield: 4.01%
Let’s Connect
©2025. Advisory services offered through Waterloo Capital, LP, An SEC Registered Investment Advisor.