
Last Week on Wall Street – December 6th, 2025
S&P 500: 0.31% DOW: 0.50% NASDAQ:0.91% 10-YR Yield: 4.14%

This Week on Wall Street – Week of Decemeber 1st
The unpredictability of the stock market was reflected this November as we saw sharp sell-offs contributing to the[…]
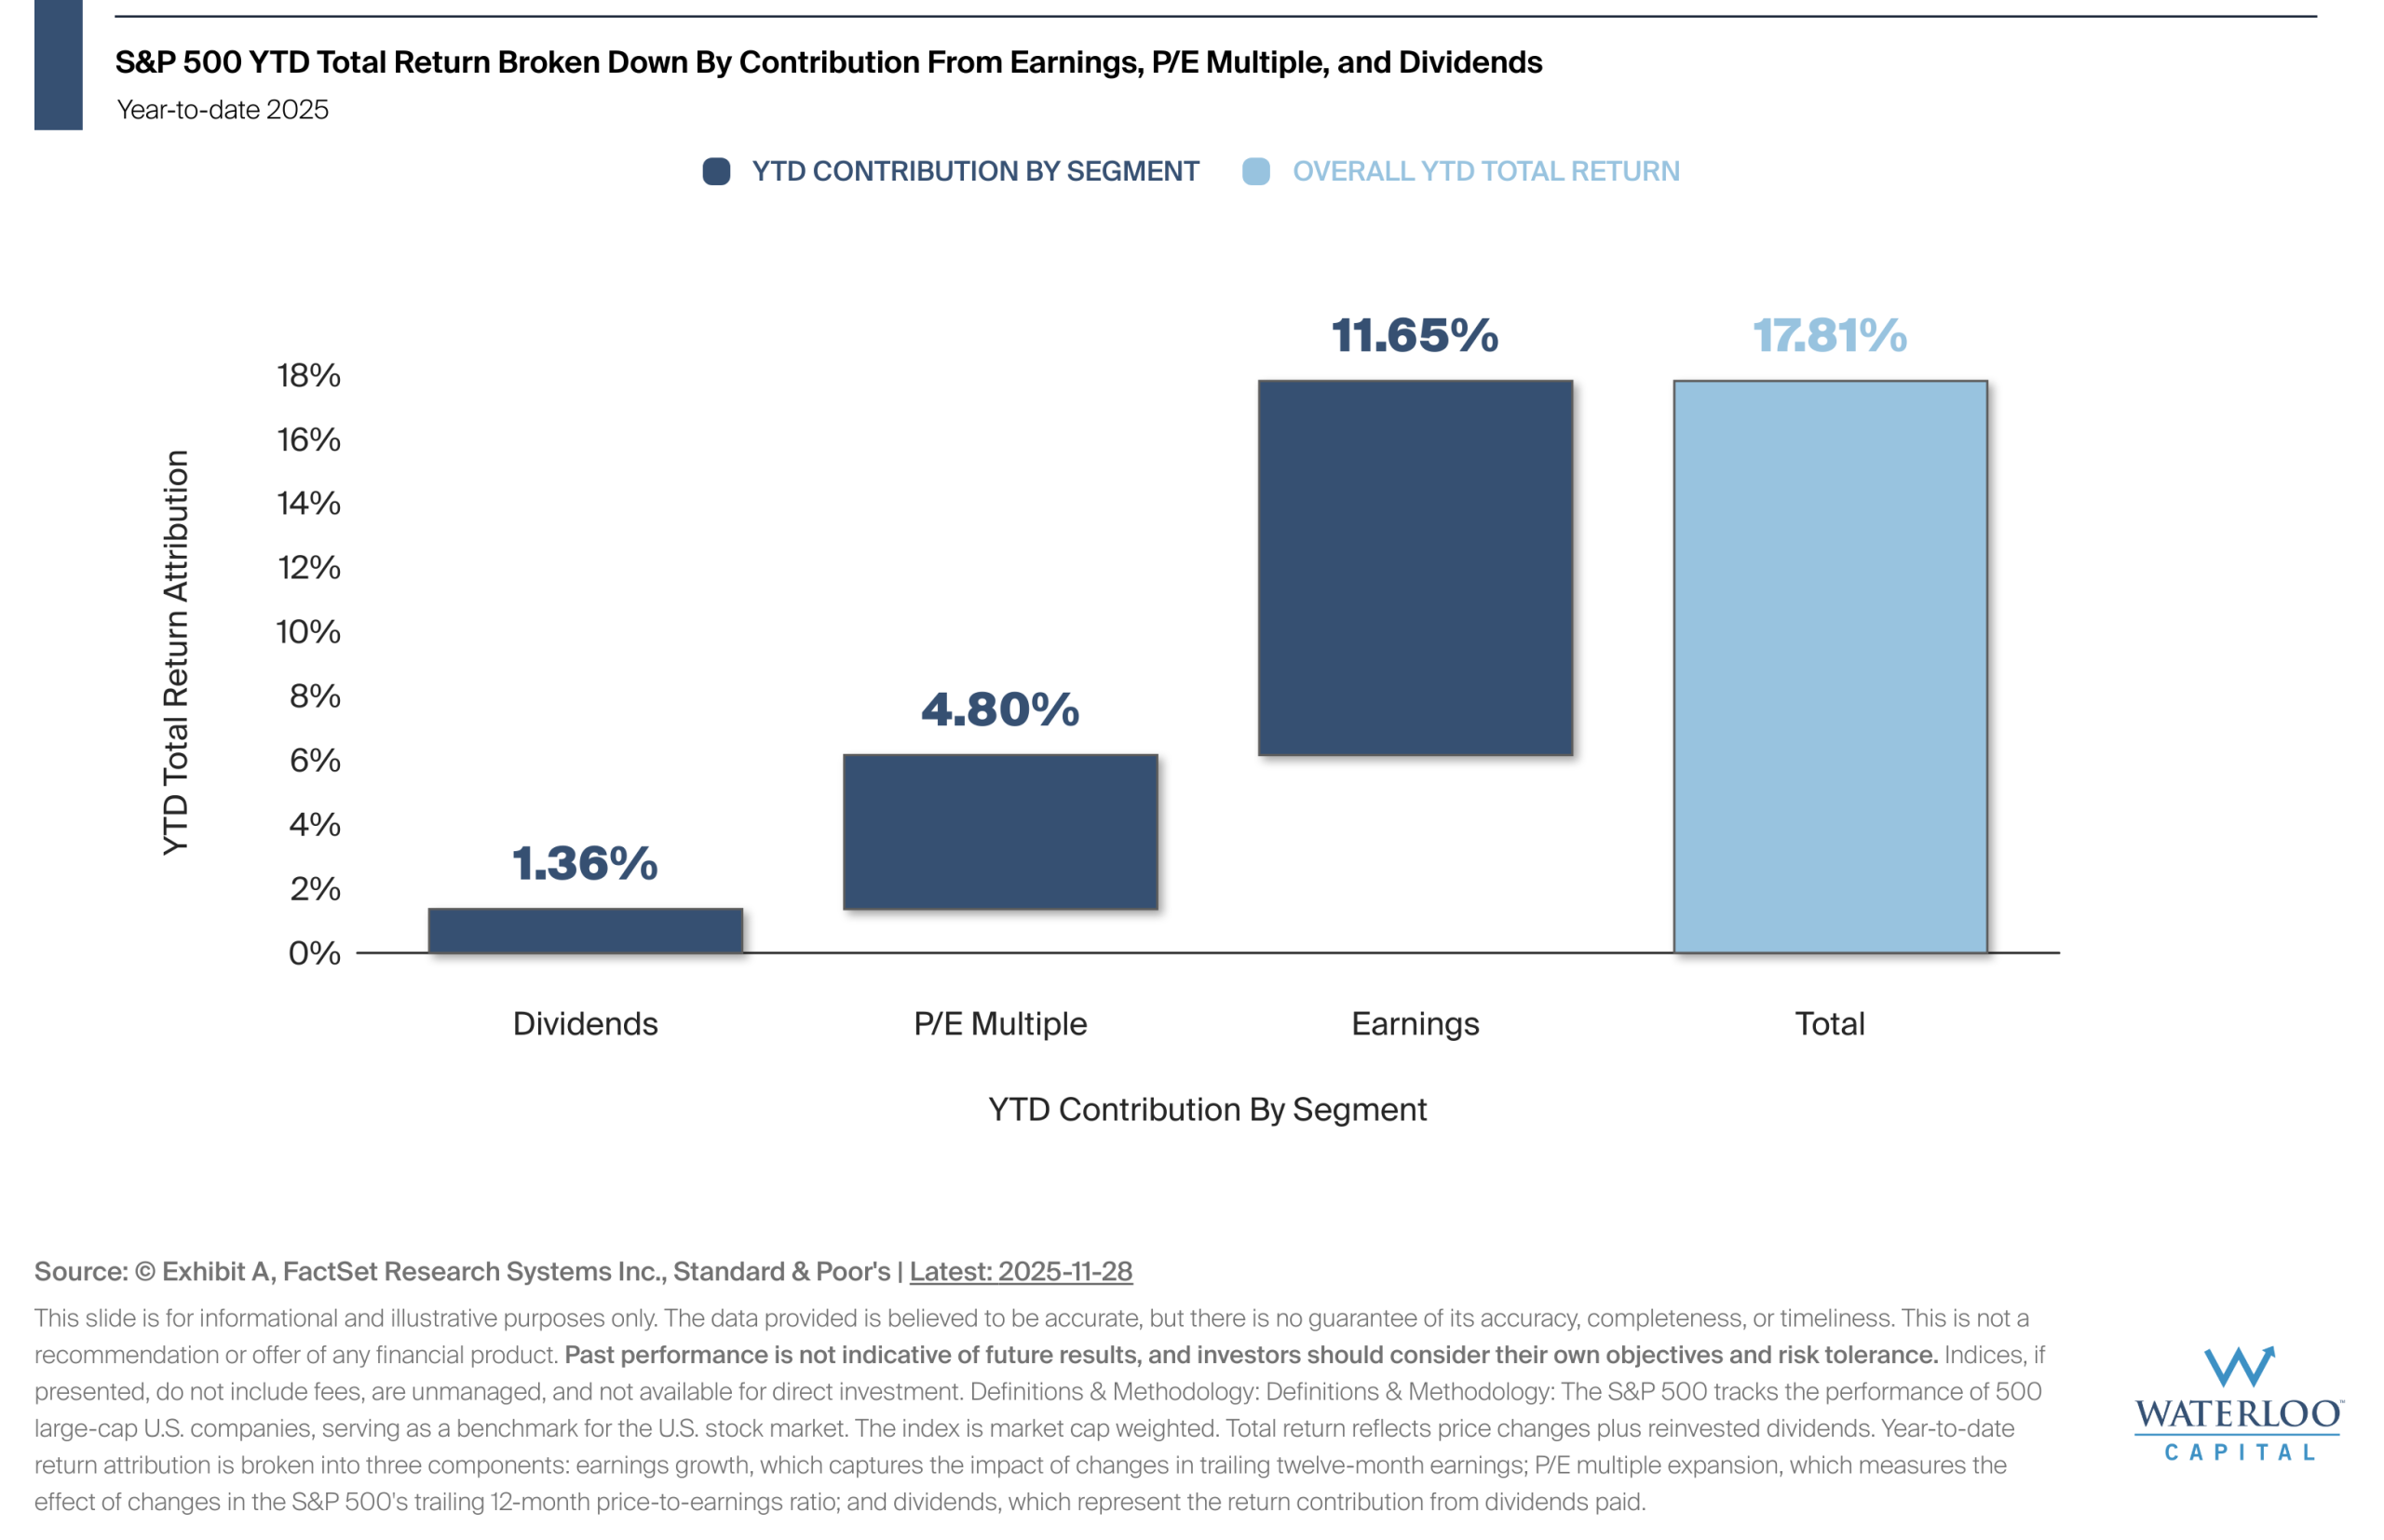
Chart Of the Week – Where Are Equity Returns Coming From In 2025?
The chart shows the S&P 500's total return year-to-date broken down into the contribution from three segments:[…]
Last Week on Wall Street – November 29th, 2025
S&P 500: 3.68% DOW: 3.19% NASDAQ:4.91% 10-YR Yield: 4.02%
This Week on Wall Street – Week of November 24th
The holiday season is upon us as we enter a shortened, Thanksgiving week.
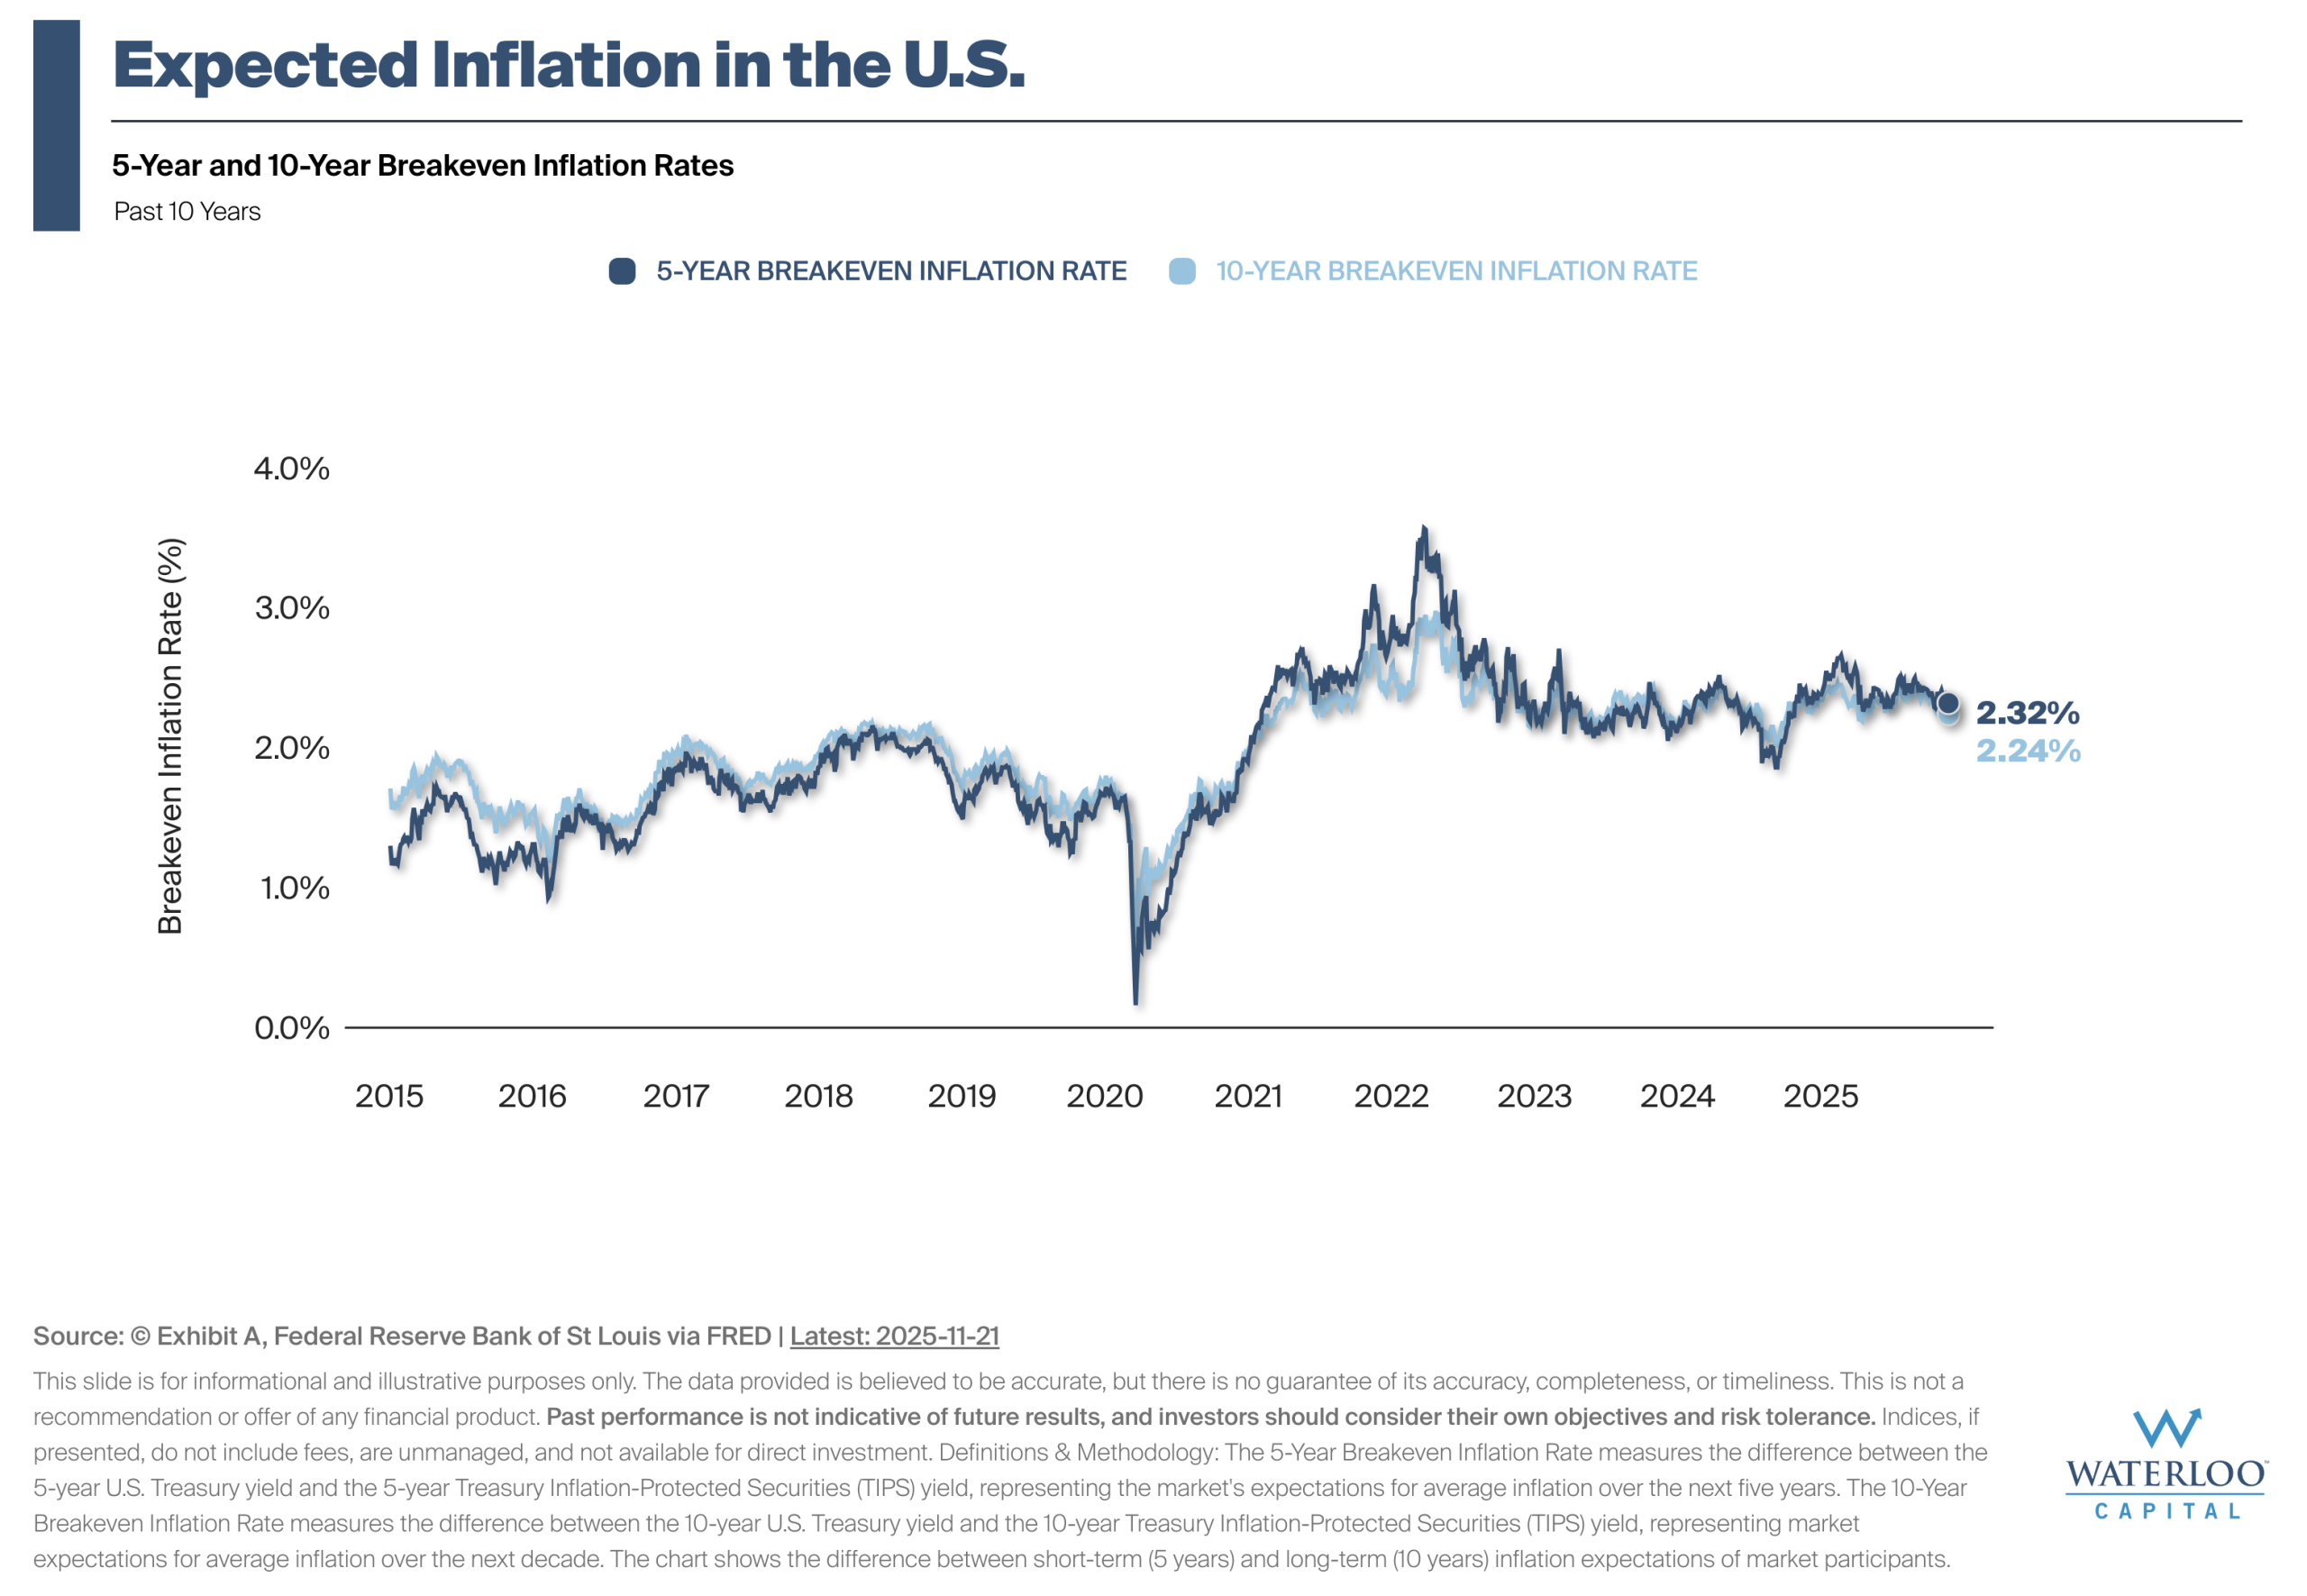
Chart Of the Week – A Peek At Forward Looking Inflation Data
The breakeven inflation rate represents the market's expectation for average annual inflation over a specific time-period, calculated[…]

Last Week on Wall Street – November 22nd, 2025
S&P 500: -1.90% DOW: -1.86% NASDAQ:-2.735% 10-YR Yield: 4.06%

Chart Of the Week – Gains Increase with Holding Period
S&P 500 data since 1950 demonstrates a clear pattern where extended timeframes have been associated with improved[…]
This Week on Wall Street – Week of November 17th
The government shutdown officially ended last Wednesday and we now await an influx of delayed data.
Last Week on Wall Street – November 15th, 2025
S&P 500: 0.08% DOW: 0.34% NASDAQ:-0.45% 10-YR Yield: 4.15%
Let’s Connect
©2025. Advisory services offered through Waterloo Capital, LP, An SEC Registered Investment Advisor.