
This Week on Wall Street – Week of December 22nd
We have a quiet week ahead with the holidays in full swing.

The AI Bubble: Closer to the Checkered Flag or the Starting Line?
Please enjoy the second theme release in our five-part series leading up to the release of Waterloo[…]
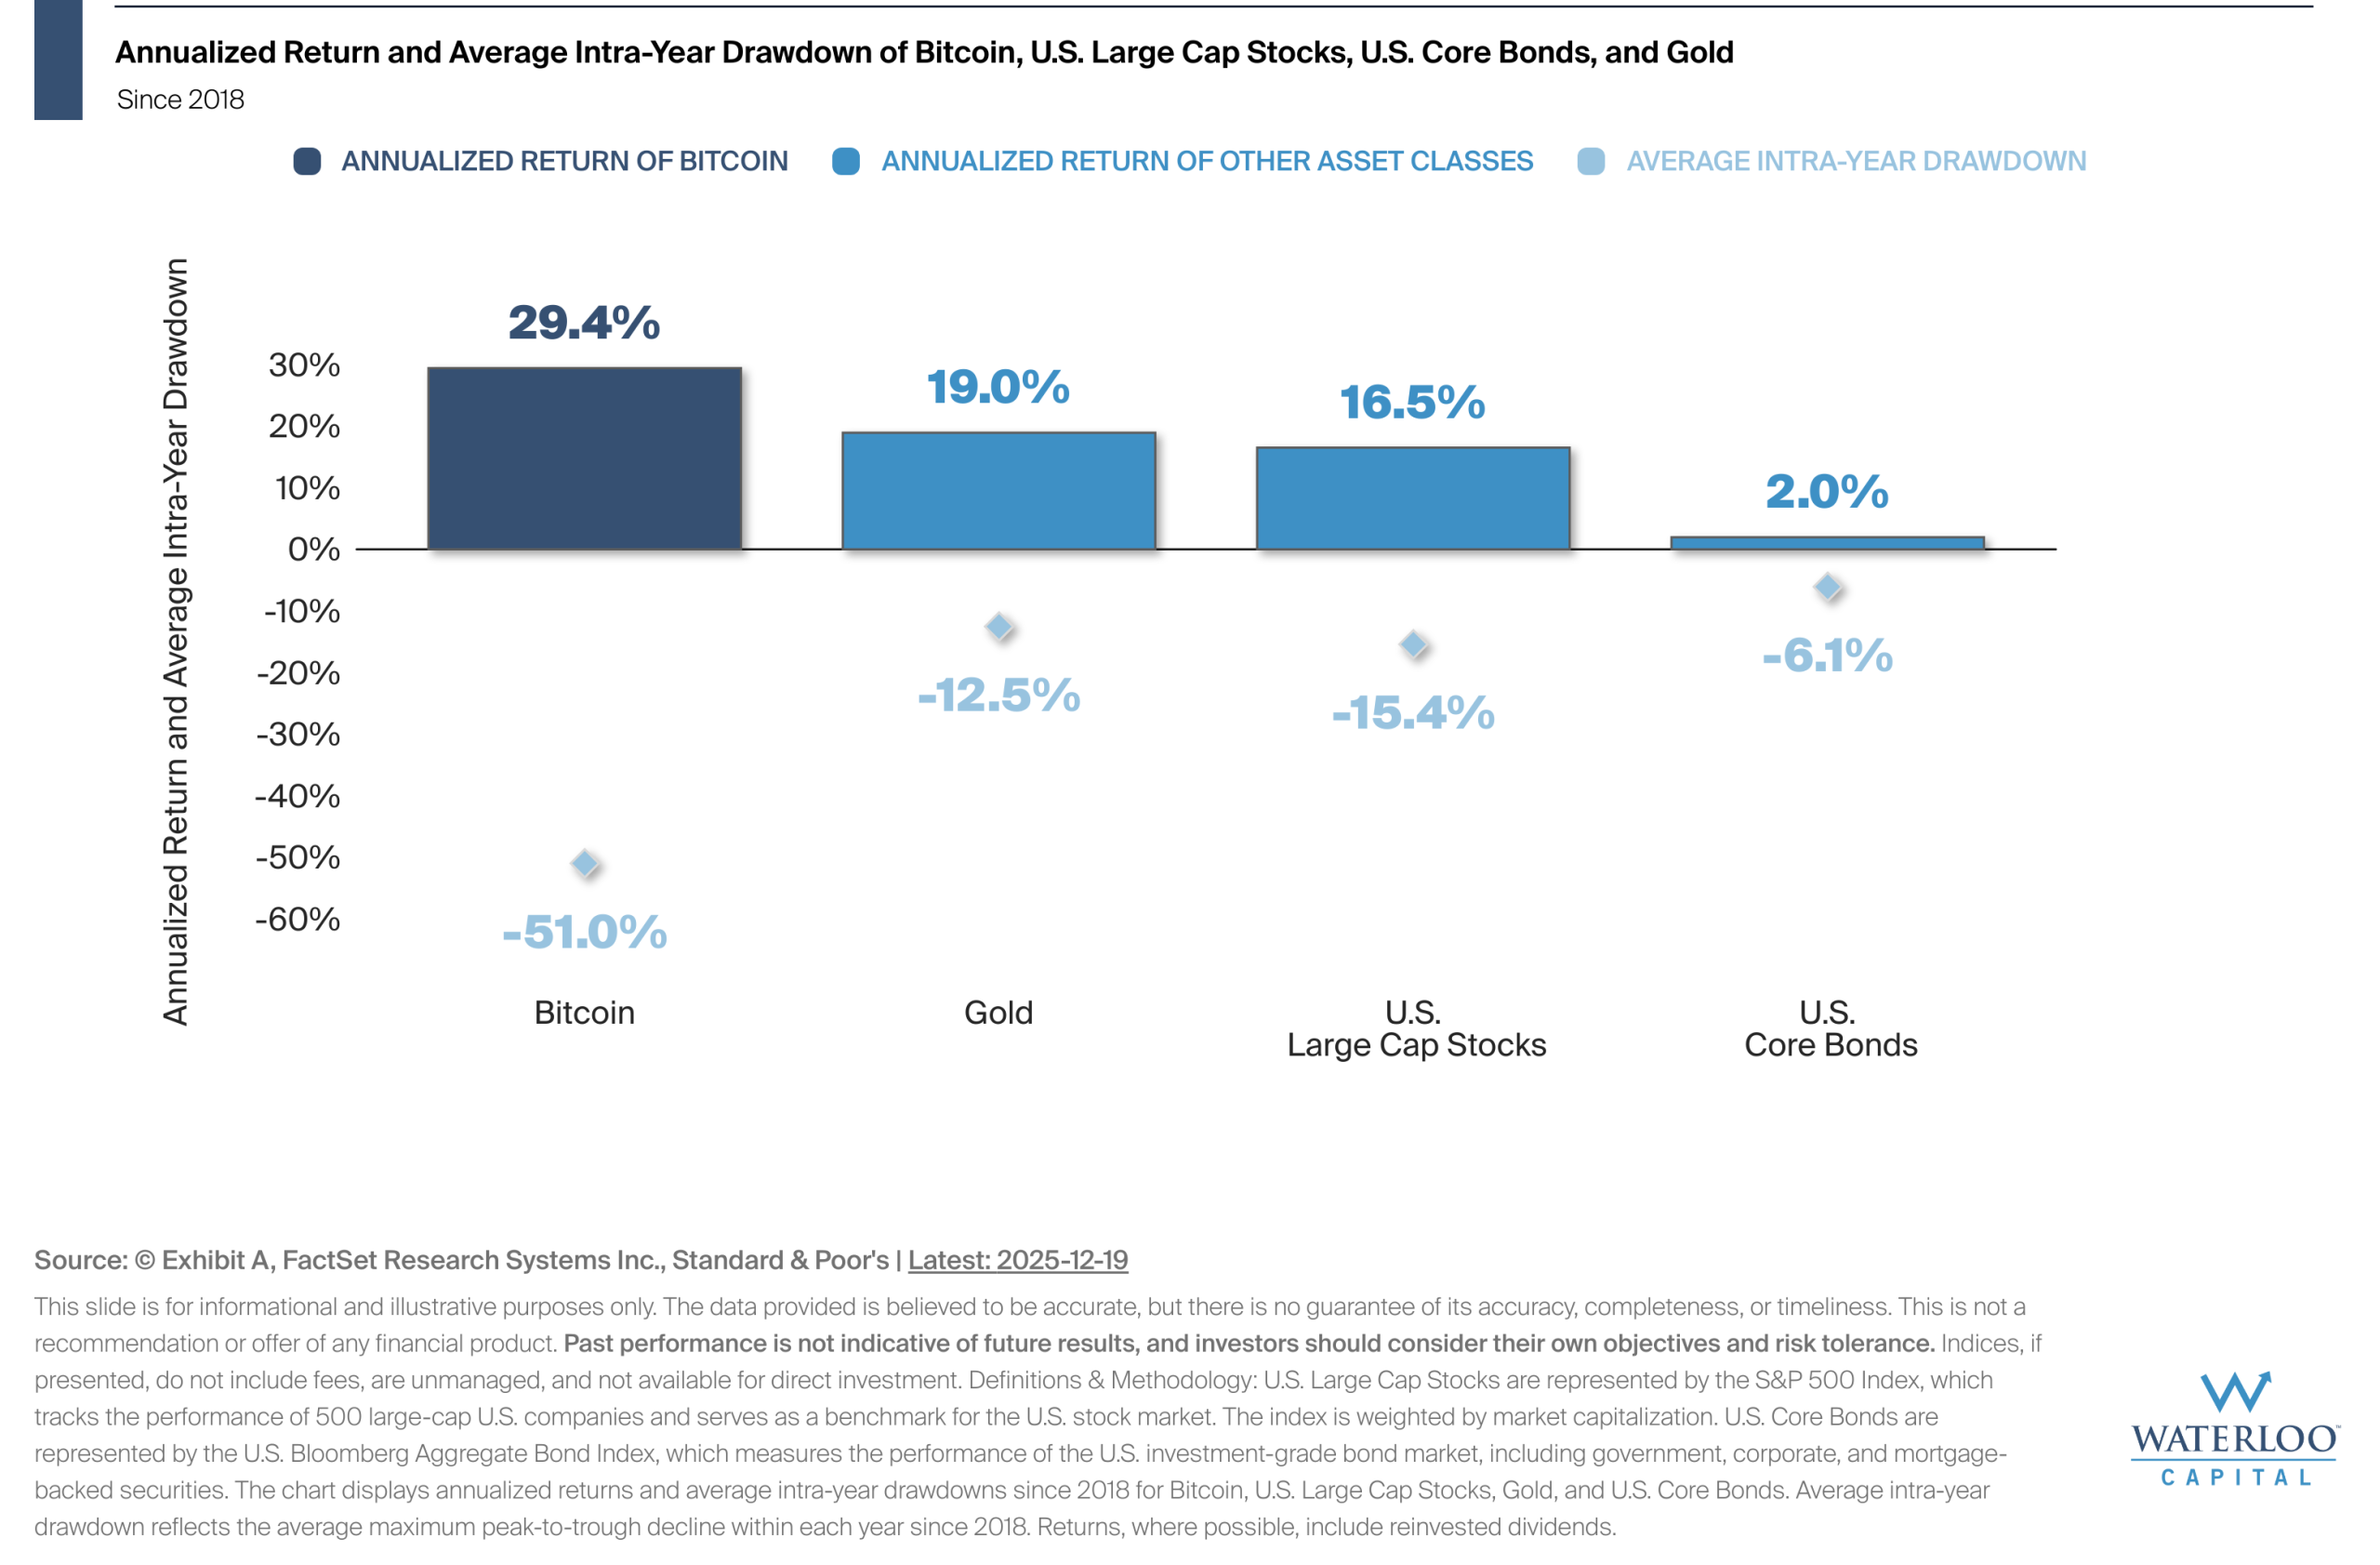
Chart Of the Week – Historically, Bitcoin Returns Have Come With Volatility
This chart puts Bitcoin's performance since 2018 into context by pairing strong returns with the deep drawdowns[…]

Last Week on Wall Street – December 21st, 2025
S&P 500: 0.10% DOW: -0.67% NASDAQ:0.48% 10-YR Yield: 4.15%

A Market Changing Seasons
Please enjoy the first theme release in our five-part series leading up to the release of Waterloo[…]
This Week on Wall Street – Week of December 15th
In the last full trading week of the year investors are hopeful that Santa Claus will bring[…]
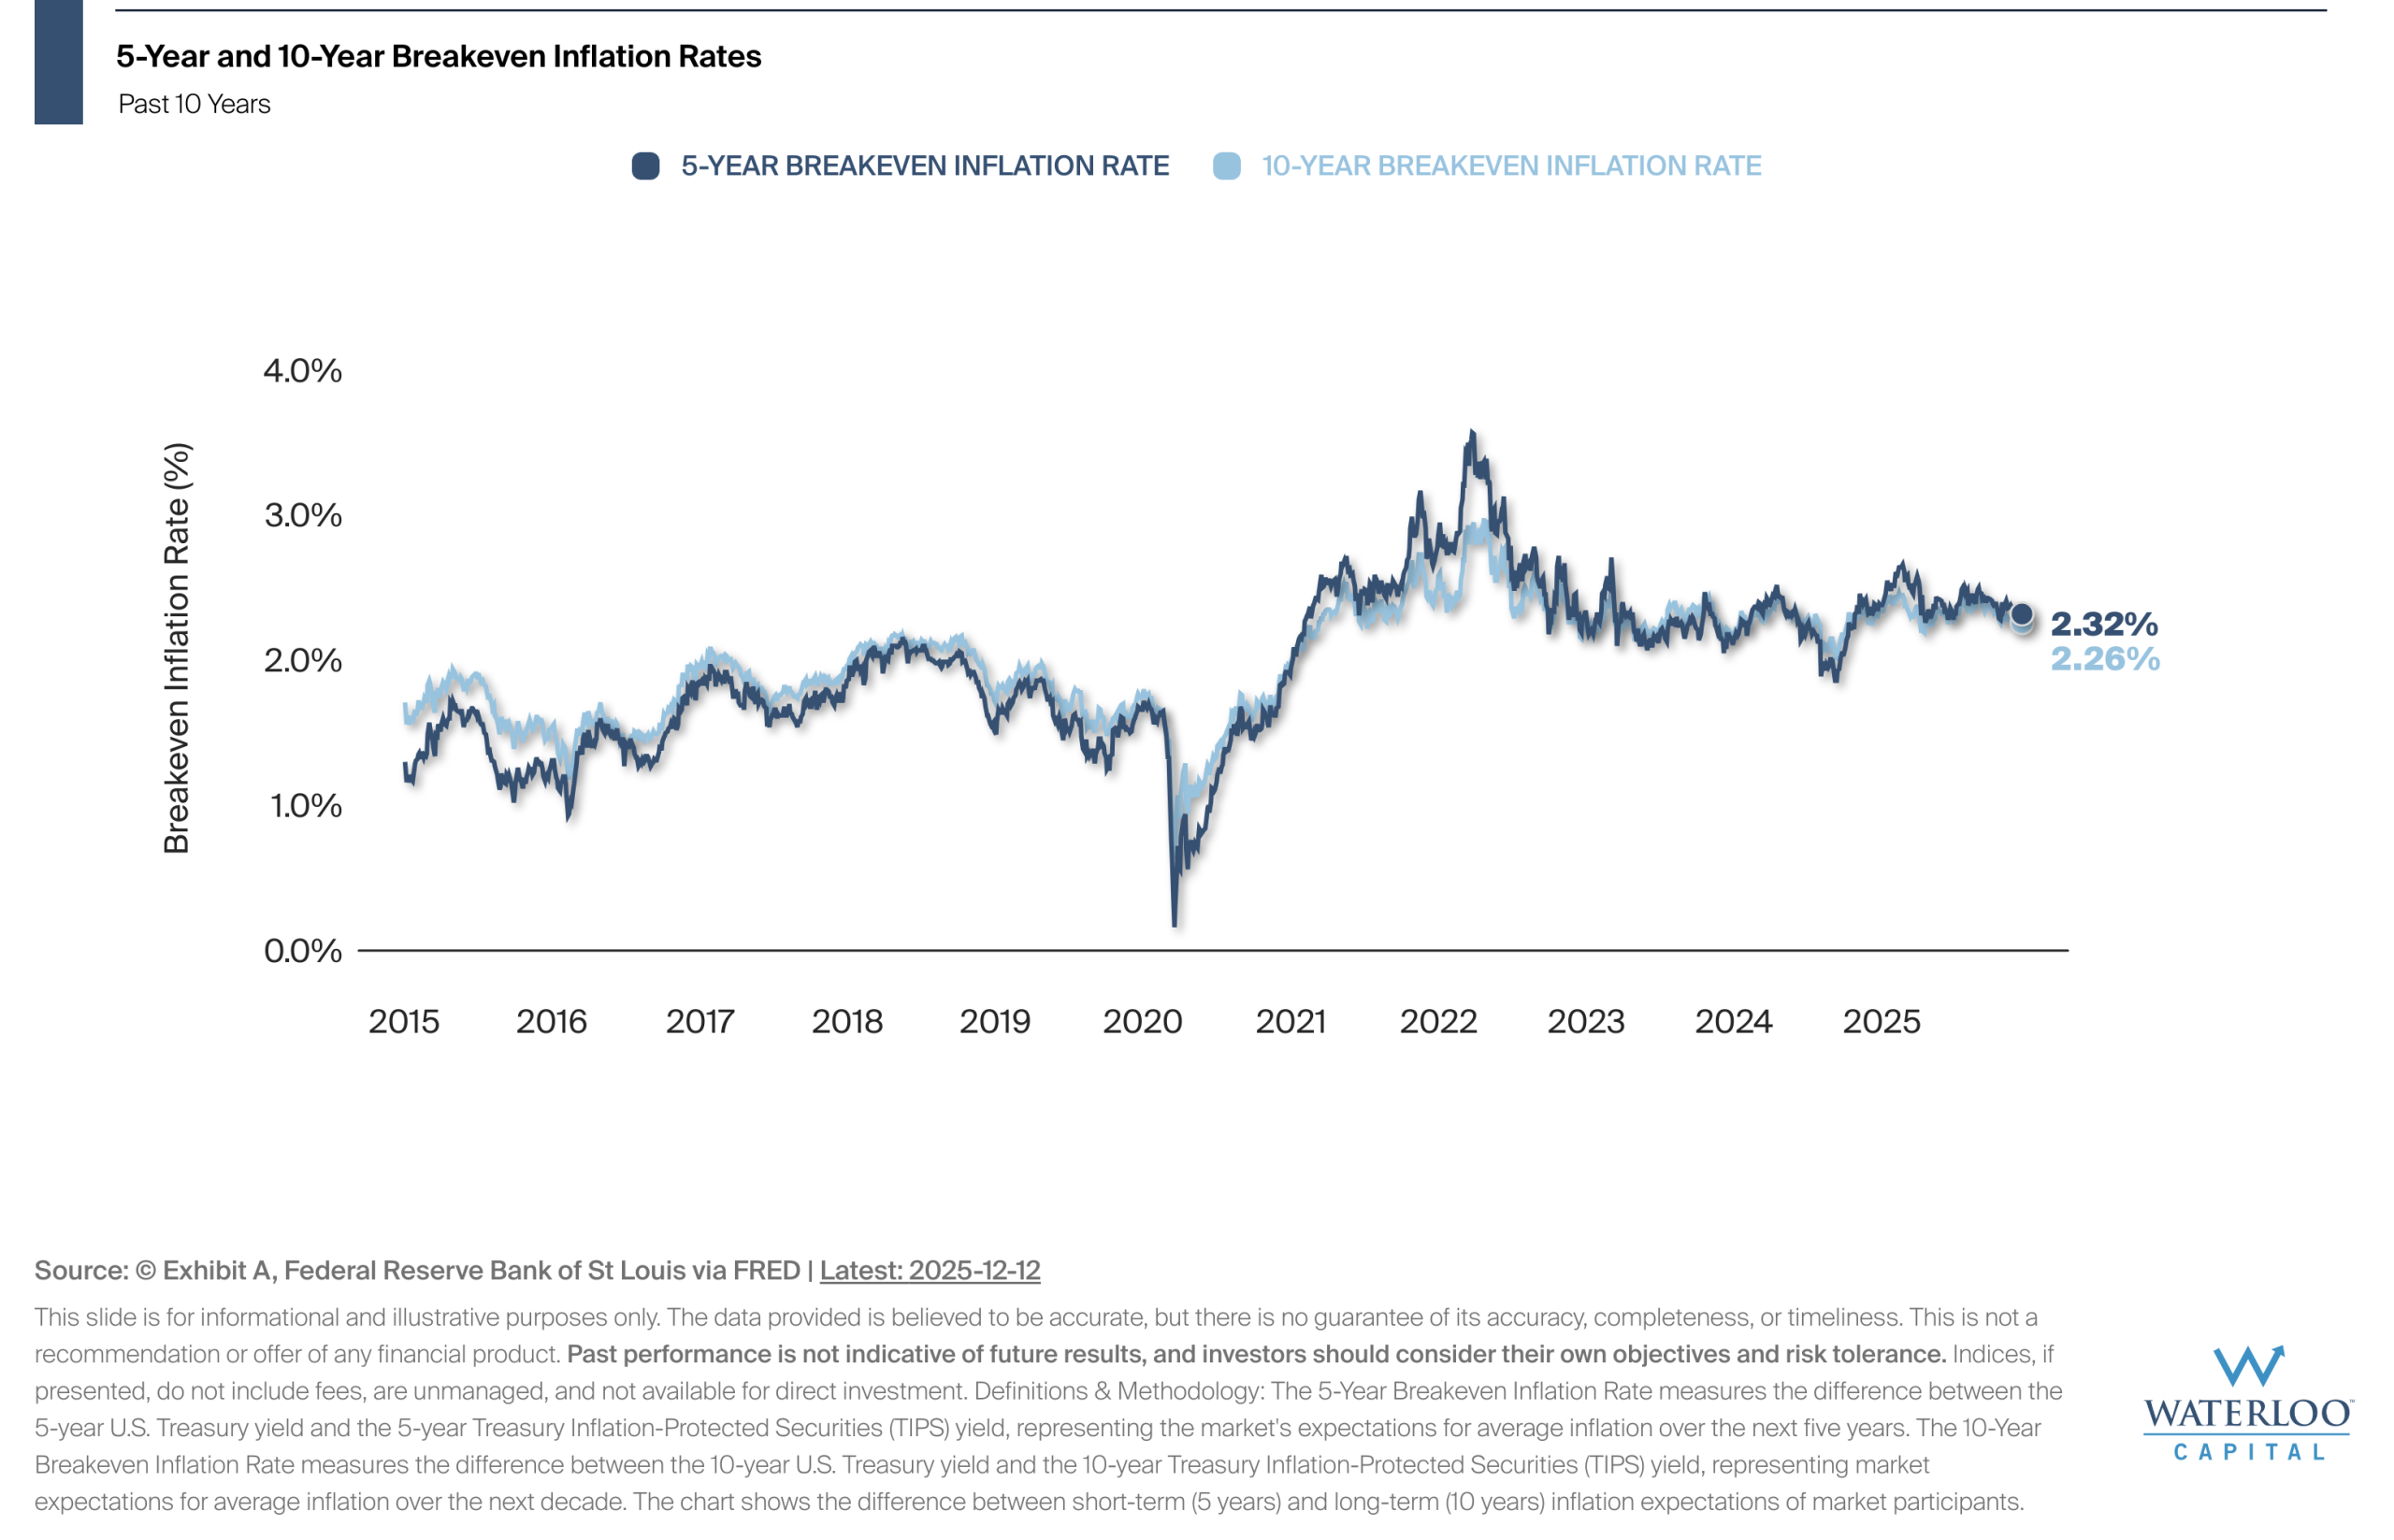
Chart Of the Week – Expected Inflation in the U.S.
The breakeven inflation rate represents the market's expectation for average annual inflation over a specific time-period, calculated[…]
Last Week on Wall Street – December 13th, 2025
S&P 500: -0.54% DOW: 1.12% NASDAQ:-1.62% 10-YR Yield: 4.19%
This Week on Wall Street – Week of December 8th
MARKET COMMENTARY Major indexes continued their advance last week, maintaining the positive momentum of the December rally.[…]
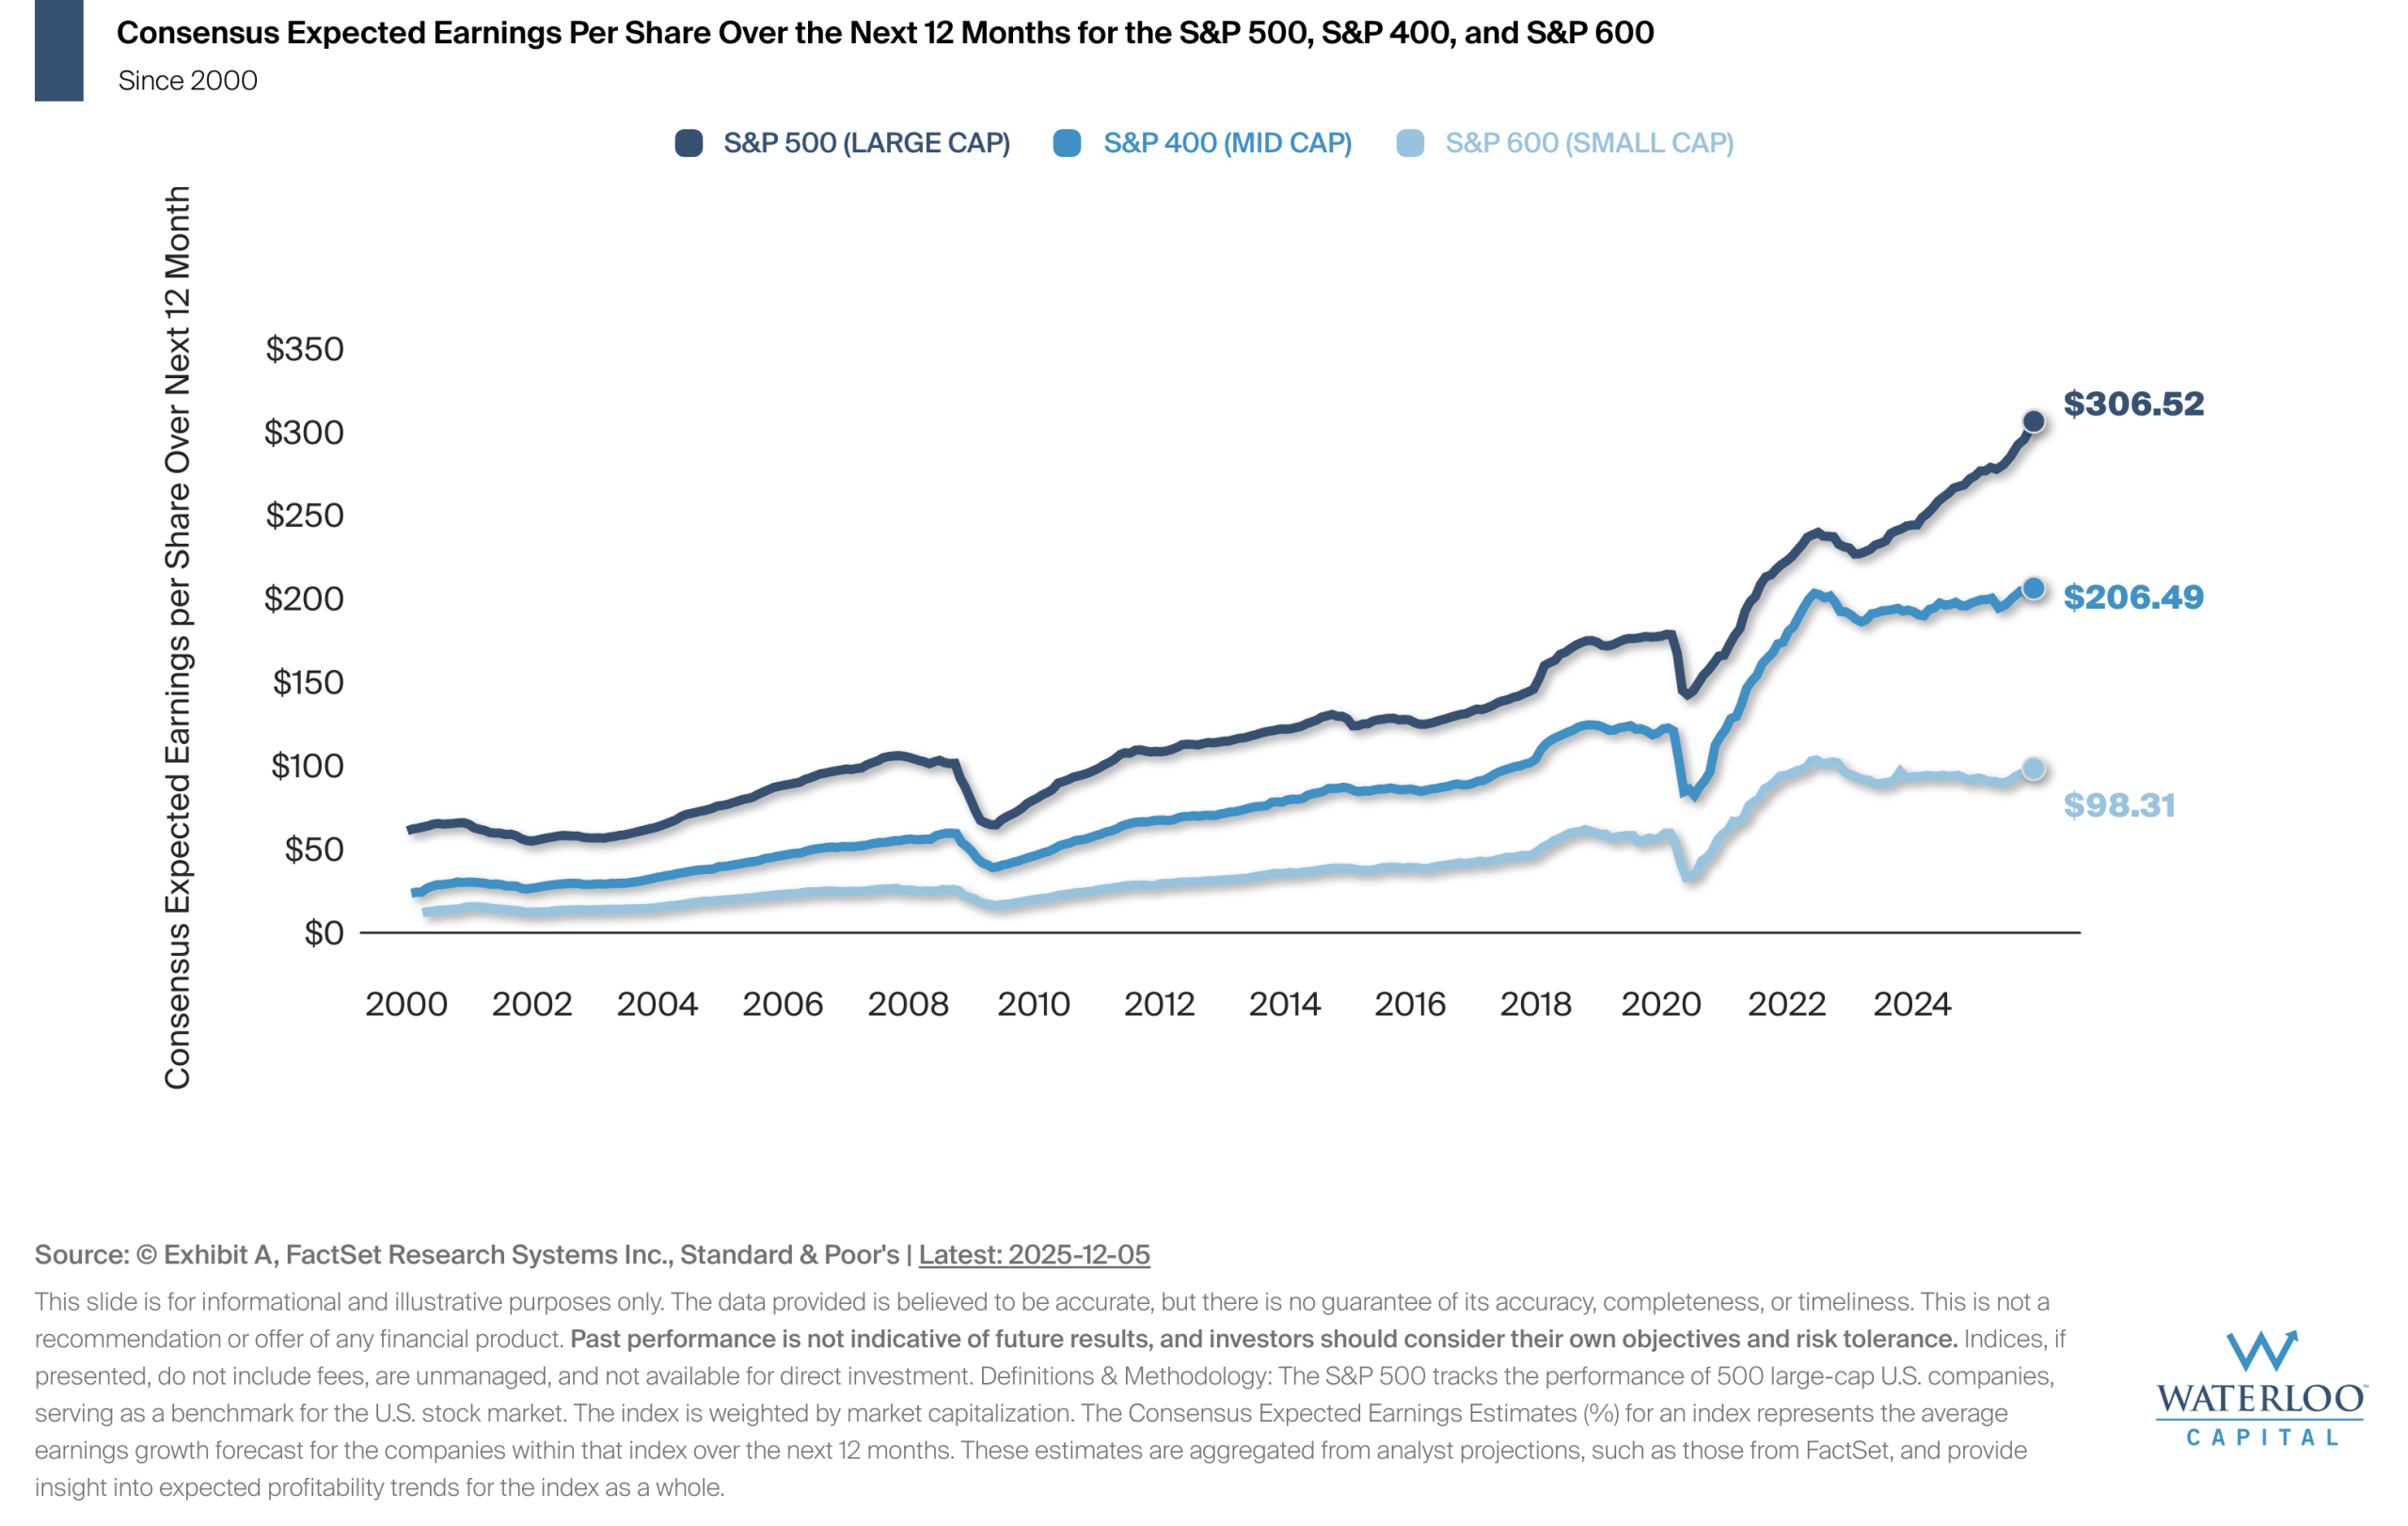
Chart Of the Week – Consensus Expected Earnings Estimates
Forward earnings estimates represent analysts' consensus projections for a company or index's earnings per share (EPS) over[…]
Let’s Connect
©2025. Advisory services offered through Waterloo Capital, LP, An SEC Registered Investment Advisor.