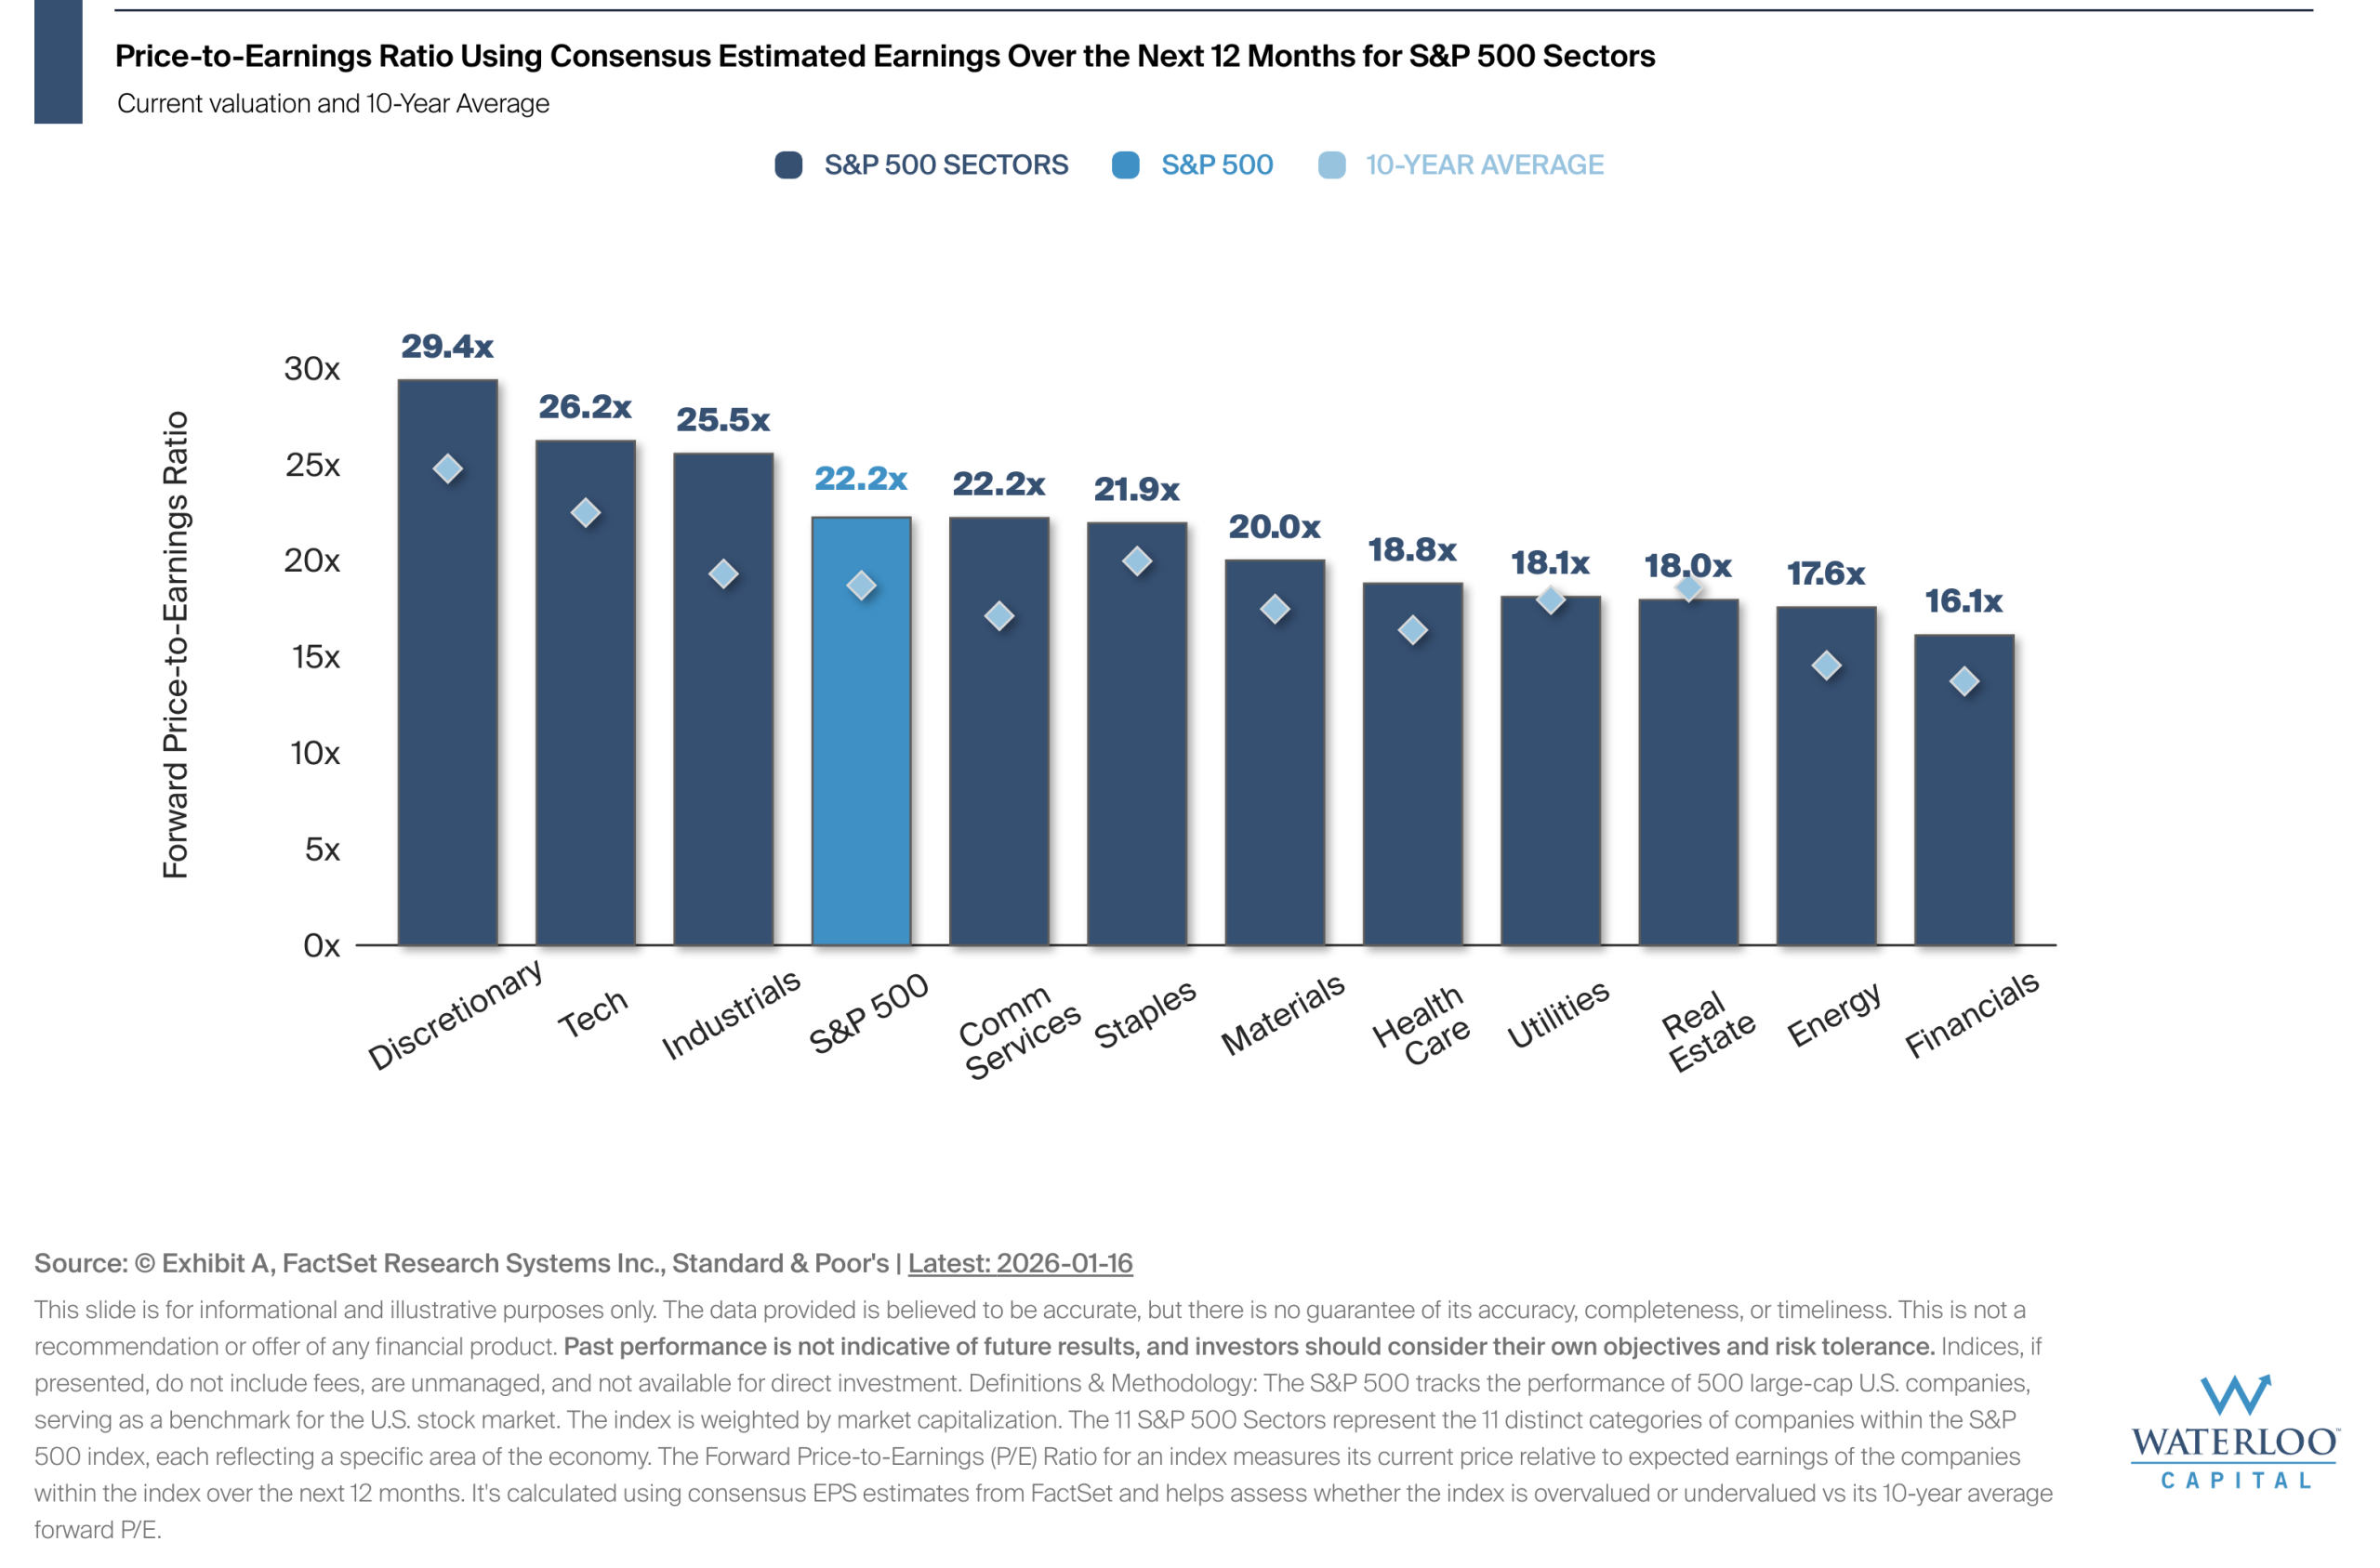
Chart Of the Week – Forward Valuations by Sector
The forward P/E ratio uses consensus estimates for earnings over the next 12 months, providing a snapshot[…]

2026 Market Outlook – Are We There Yet?
Last year, markets and the economy defied gravity, climbing higher even as elevated interest rates generated heavy[…]
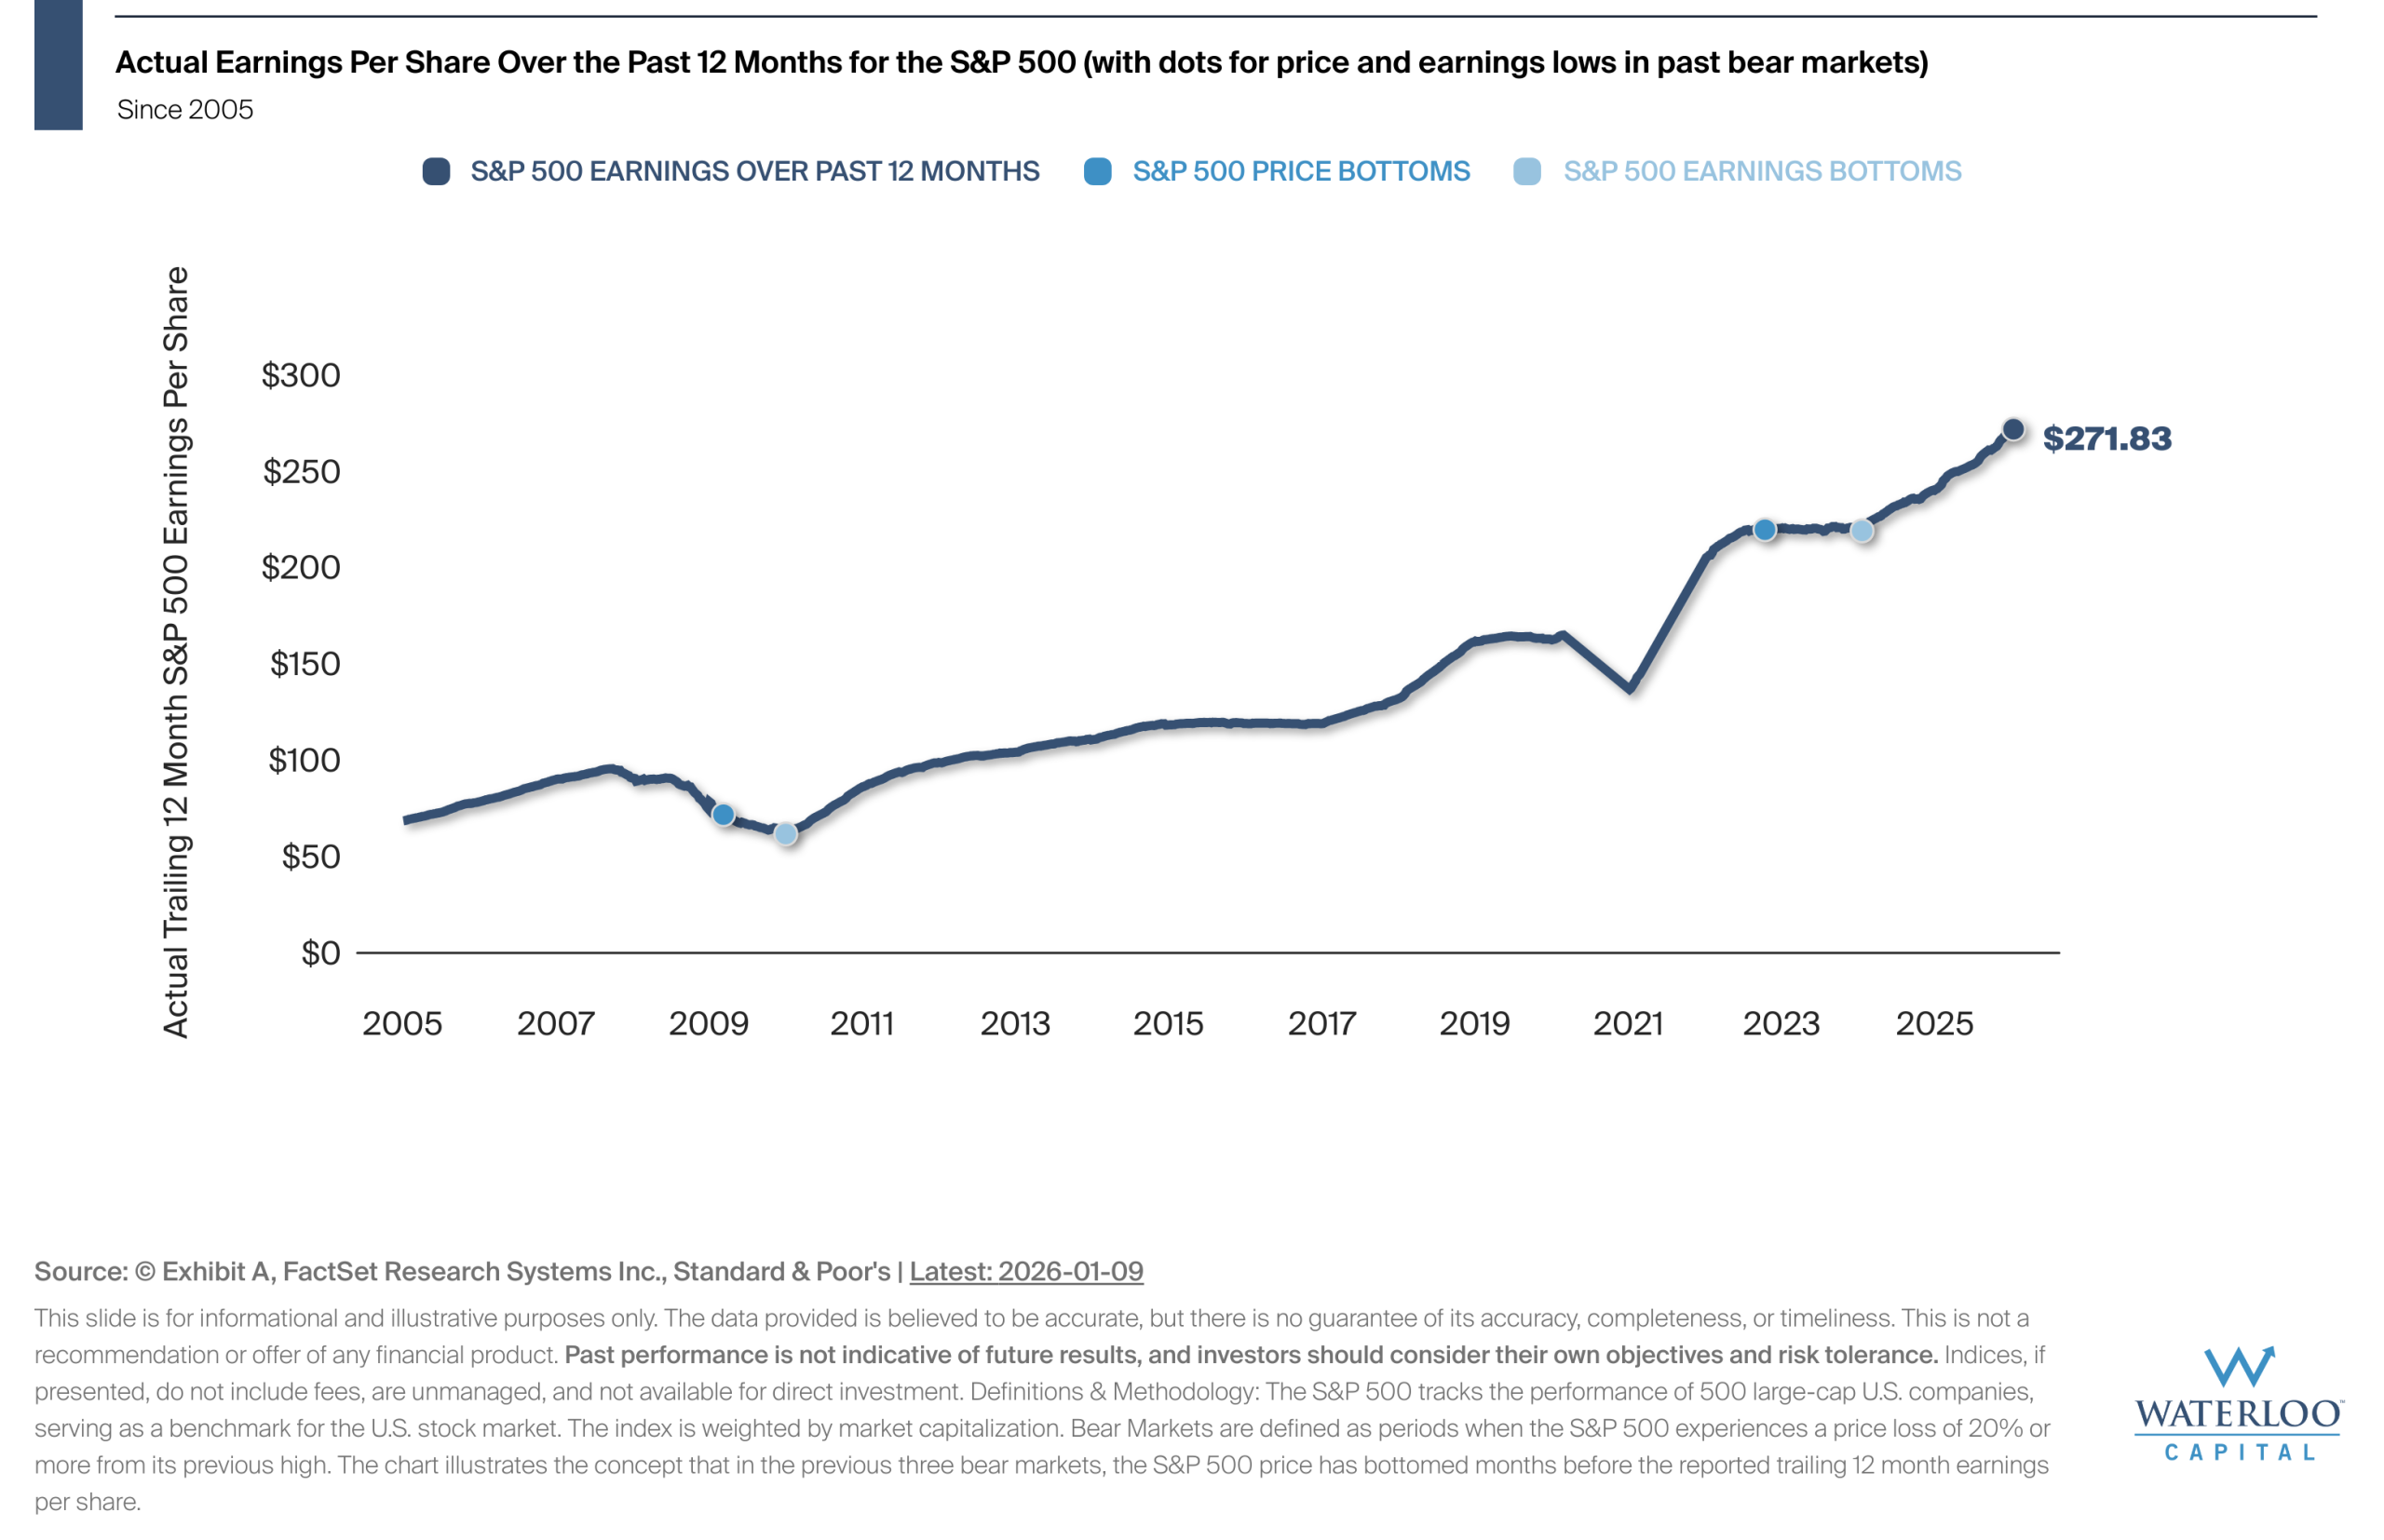
Chart Of the Week – Price Has Bottomed Before Earnings in Bear Markets
While it may feel safer to wait until things "look better", history shows that the market often[…]

This Week on Wall Street – Week of January 12th
2026 is kicking off strong, with all three of our major indexes ending last week in the

Last Week on Wall Street – January 10th, 2025
S&P 500: 0.10% DOW: -0.67% NASDAQ:0.48% 10-YR Yield: 4.15%

Taking the Alternate Route
Please enjoy the fifth theme release in our five-part series leading up to the release of Waterloo[…]

The Policy of Tolerance
Please enjoy the fourth theme release in our five-part series leading up to the release of Waterloo[…]
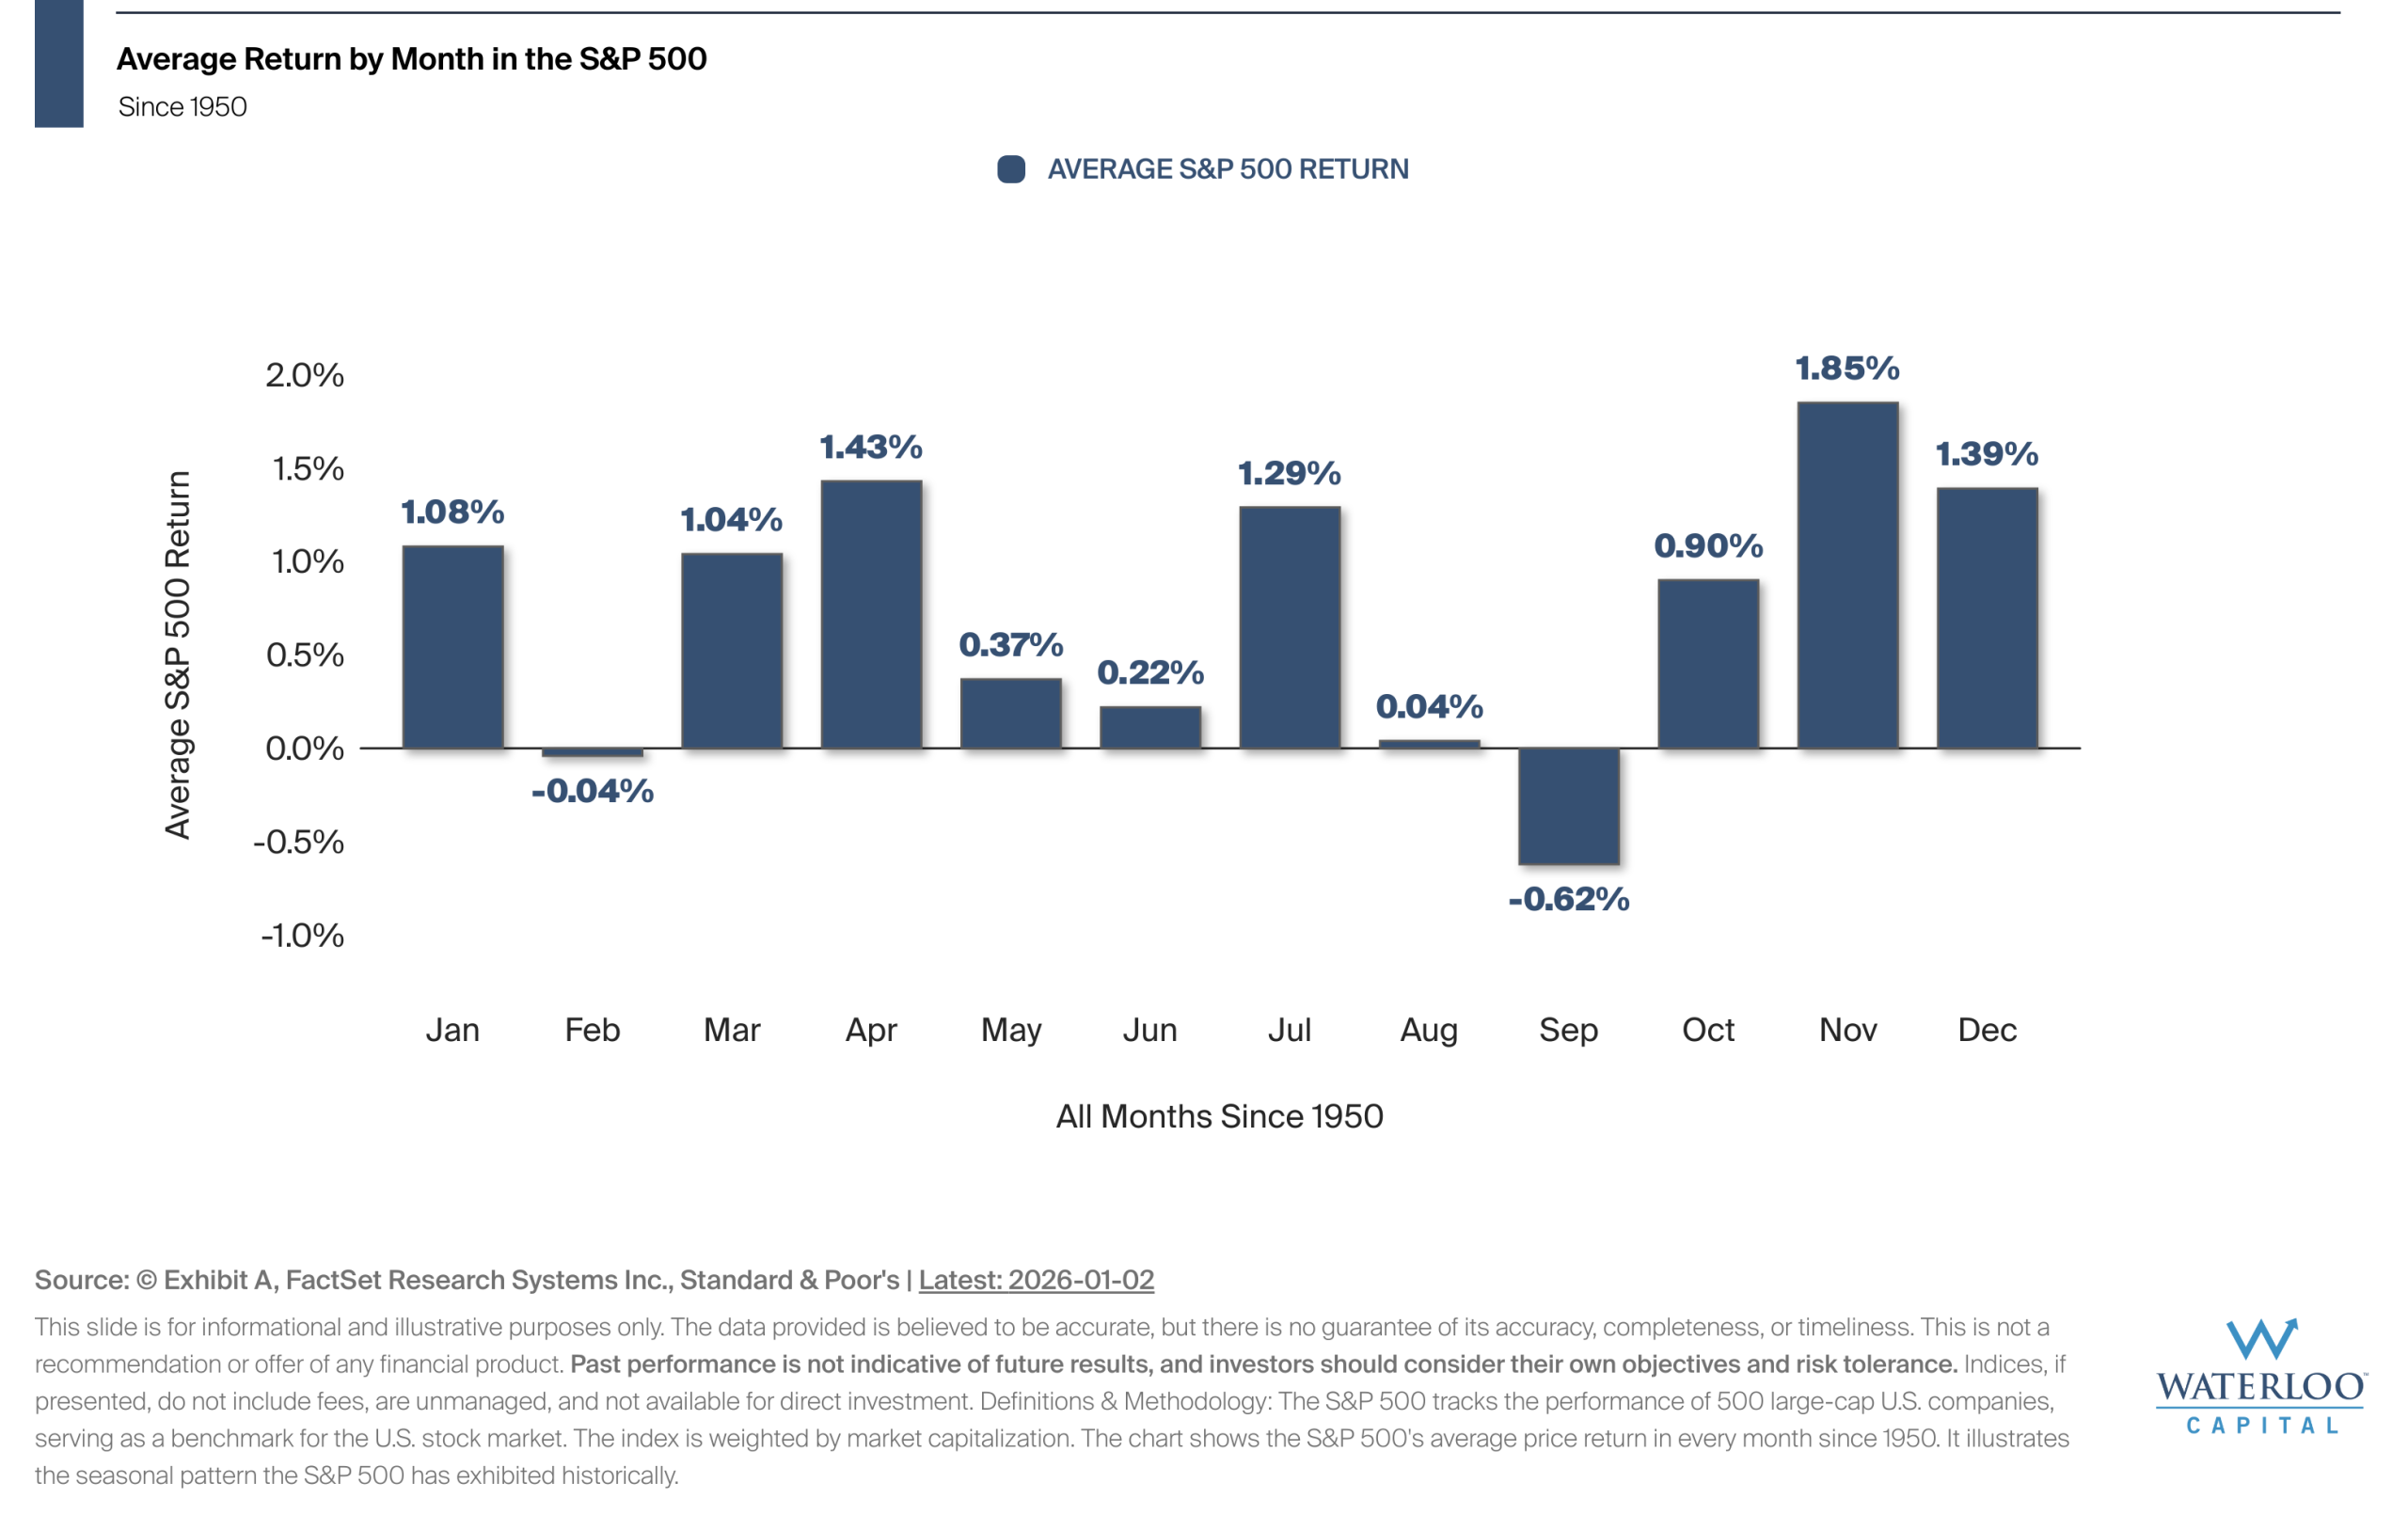
Chart Of the Week – Average Return by Month in the S&P 500
Seasonality refers to recurring trends in market performance during specific times of the year.
This Week on Wall Street – Week of January 5th
Happy New Year! Markets overall started off strong last Friday during the first trading day of the[…]

Growth Across an Uneven Ground
Please enjoy the third theme release in our five-part series leading up to the release of Waterloo[…]
Let’s Connect
©2025. Advisory services offered through Waterloo Capital, LP, An SEC Registered Investment Advisor.