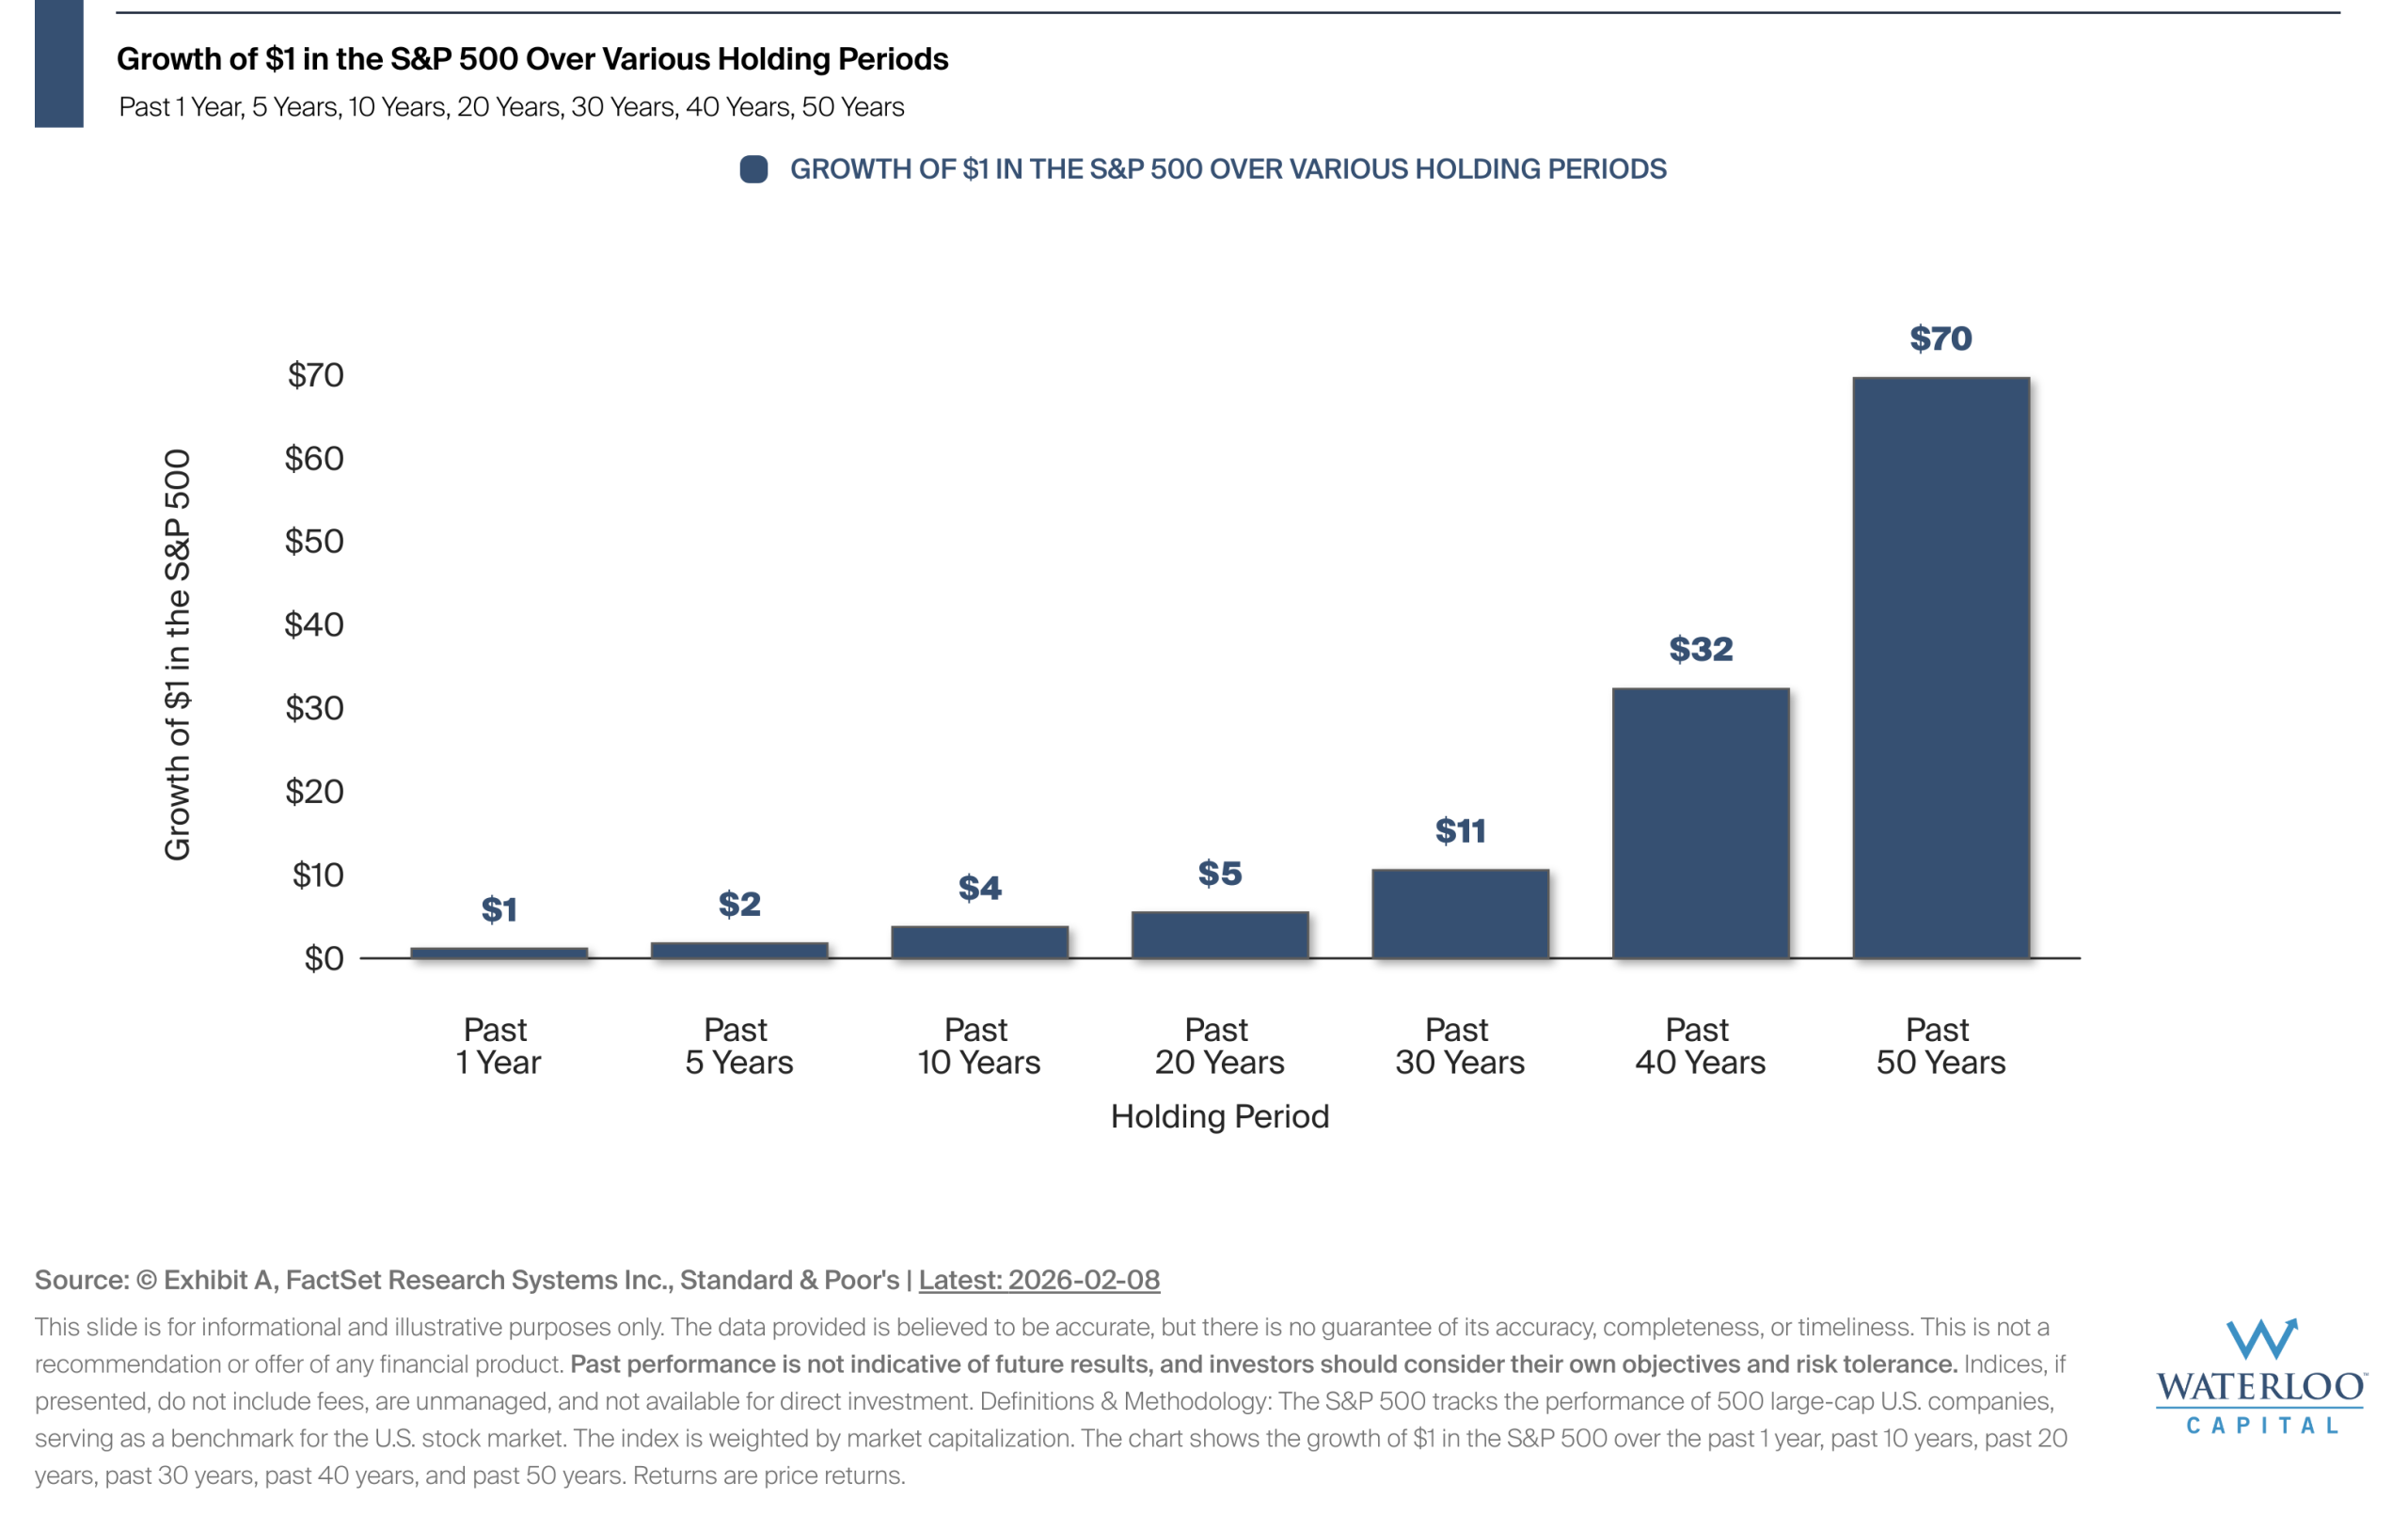
Chart Of the Week – The Impact Time Has Historically Had On Returns
S&P 500 growth patterns show how maintaining investments over decades has historically transformed modest contributions into substantial

This Week on Wall Street – Week of February 9th
The markets were on a steep downhill ride last week, but managed to end Friday on the upside.

Last Week on Wall Street – February 7th, 2026
S&P 500: -0.10% DOW: 2.5% NASDAQ: -1.87% 10-YR Yield: 4.217%
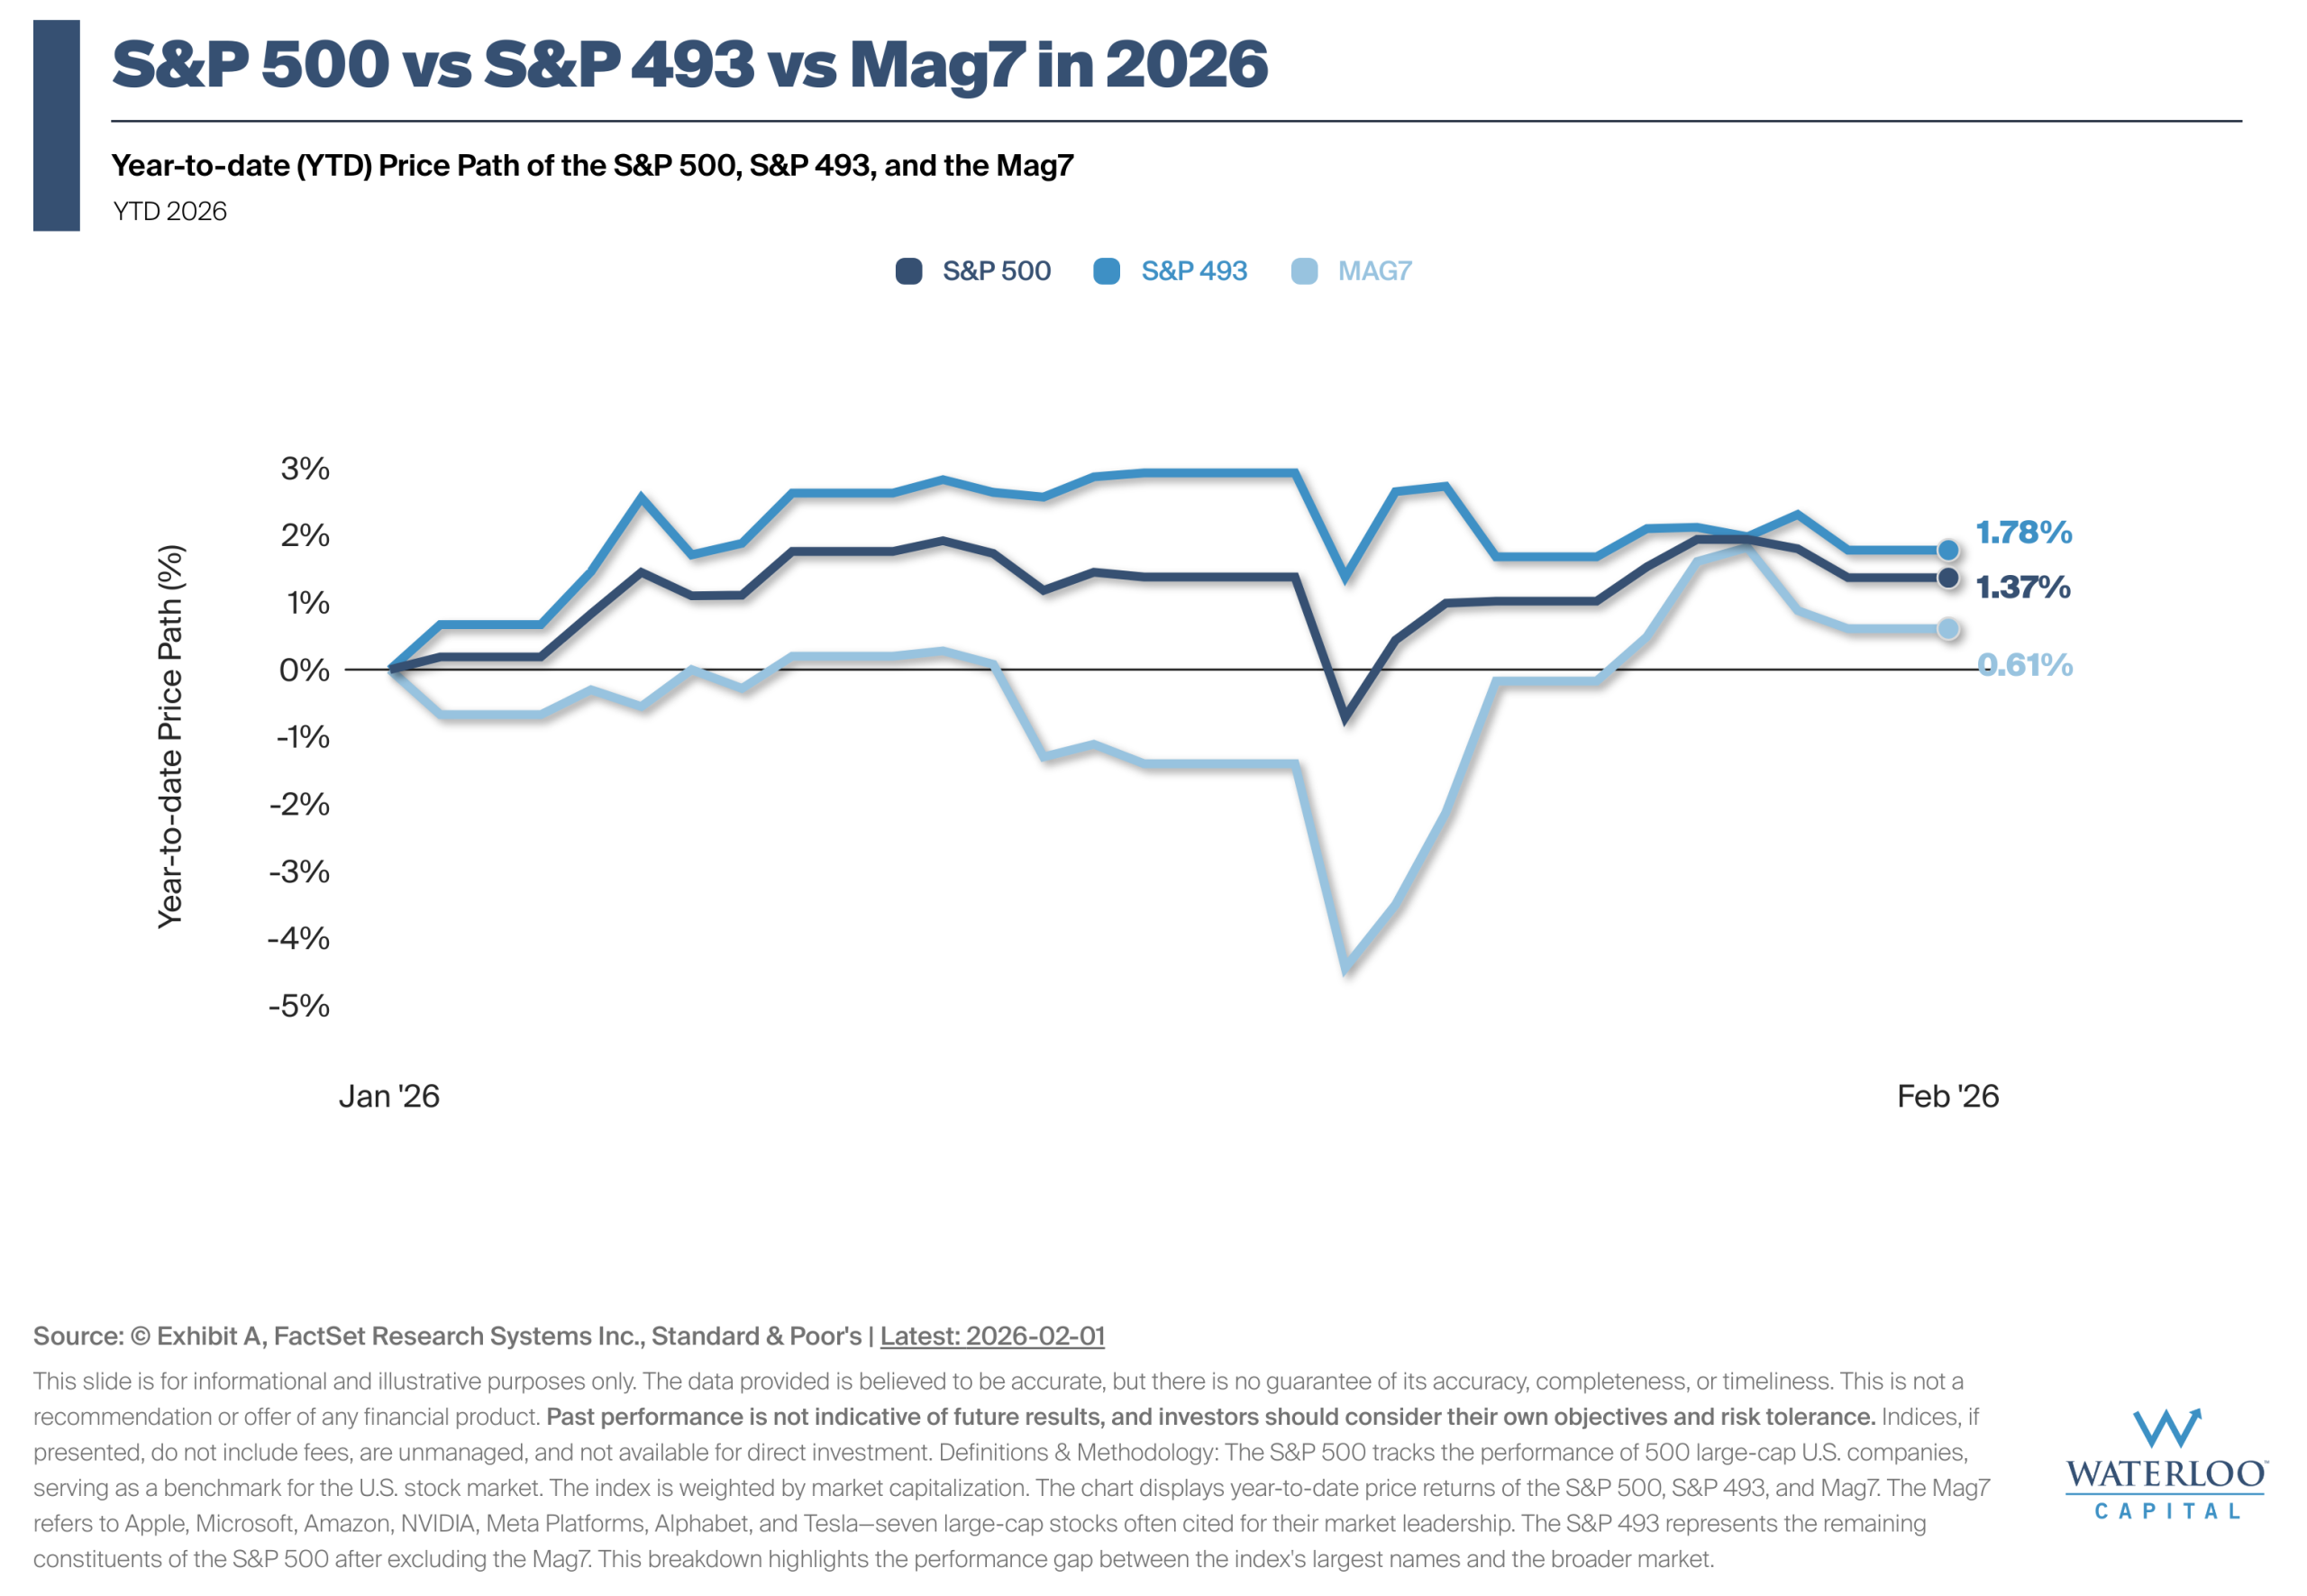
Chart Of the Week – S&P 500 vs S&P 493 vs Mag7 in 2026
The chart shows the year-to-date return paths for the S&P 500, the S&P 493, and the Mag7.
This Week on Wall Street – Week of February 2nd
With earnings season upon us, speculation around heavy investment in AI continues to build.
Last Week on Wall Street – January 31st, 2025
S&P 500: 0.34% DOW: -0.42% NASDAQ: -0.17% 10-YR Yield: 4.24%

This Week on Wall Street – Week of January 26th
Markets haven't had the hottest start to the year, with the S&P 500 seeing two consecutive weeks[…]
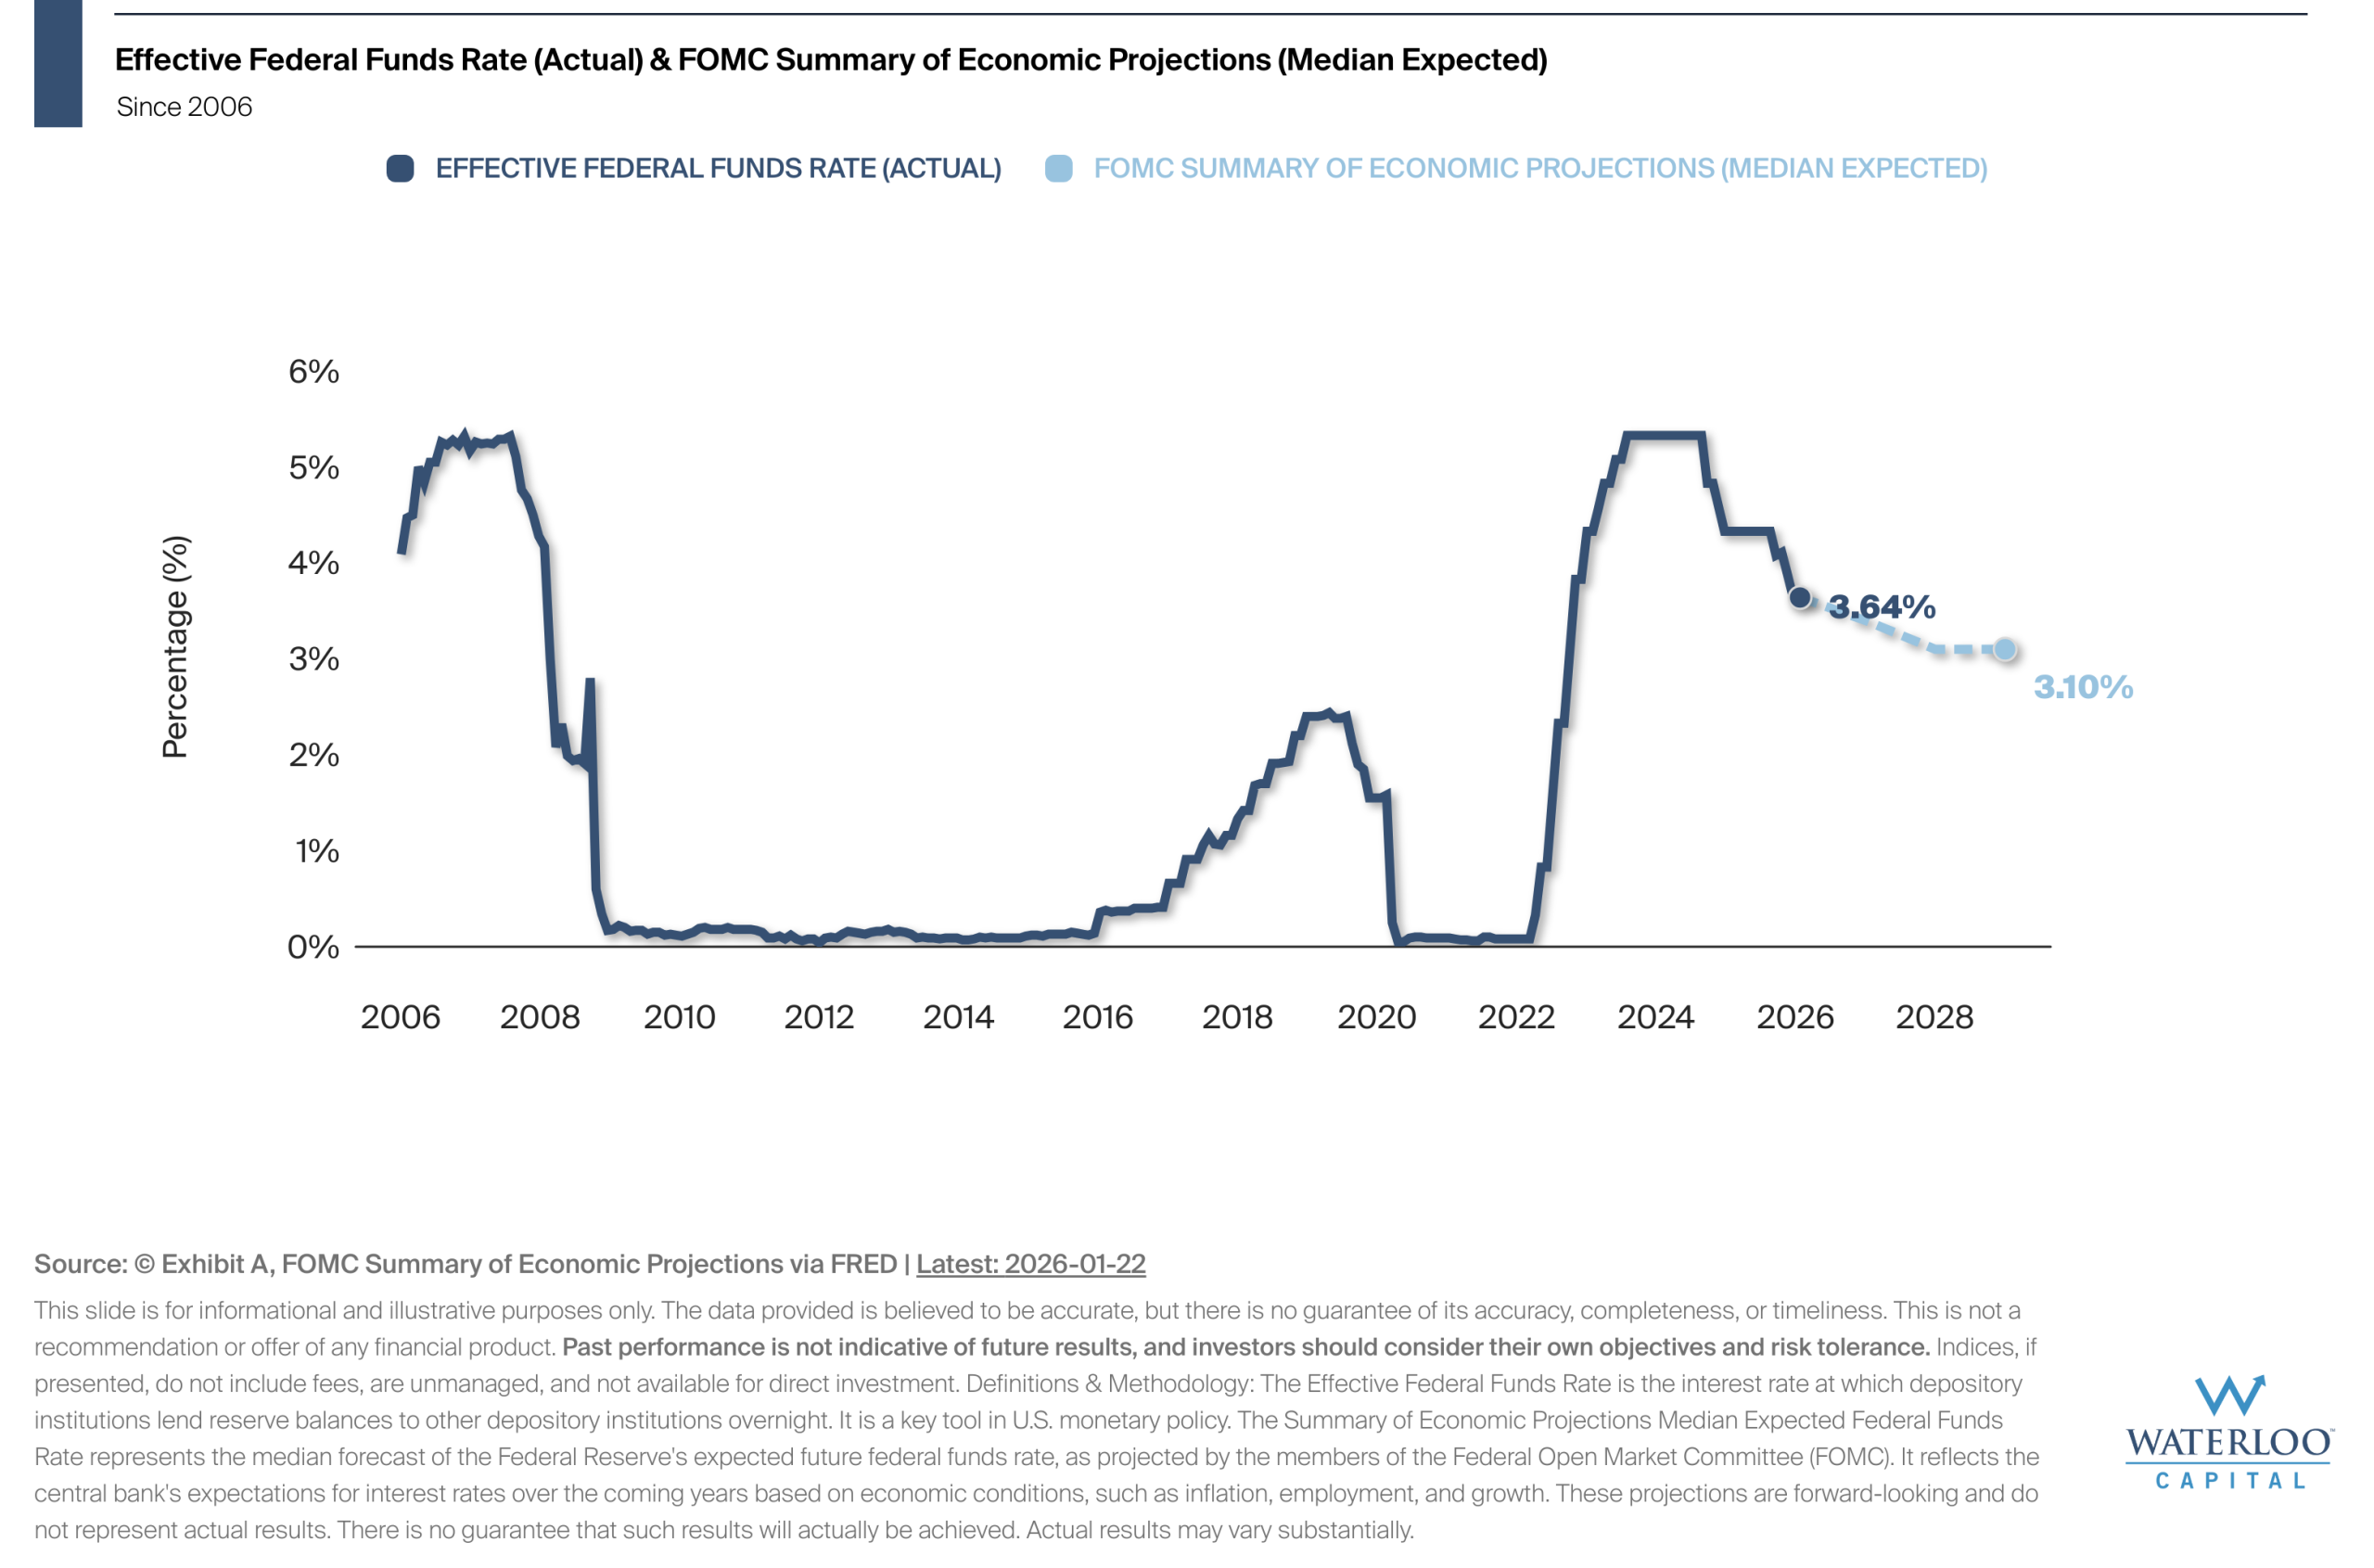
Chart Of the Week – Federal Funds Rate and FOMC Projection
The effective federal funds rate is the interest rate at which depository institutions lend reserve balances to[…]
Last Week on Wall Street – January 24th, 2025
S&P 500: -0.35% DOW: -0.53% NASDAQ: -0.06% 10-YR Yield: 4.23%
This Week on Wall Street – Week of January 20th
Tariff pressures remain a hot topic following new announcements that a 10% import tax could be placed[…]
Let’s Connect
©2025. Advisory services offered through Waterloo Capital, LP, An SEC Registered Investment Advisor.