
S&P 500: -2.12% DOW: -0.83% NASDAQ: -3.24% 10-YR Yield: 4.43%
What Happened?
Wall Street spent this week doing the geopolitical hokey-pokey: relief rally Monday, tech selloff Tuesday, peace-proposal pop Wednesday, Iran-rejection dump Thursday, and a cautious slide into Friday’s close. The through-line? Every session moved on the same variable, Iran, and every move reversed the moment the headline changed. By Friday’s bell, the S&P 500 was tracking toward its fifth consecutive weekly decline, a losing streak not seen since 2022.
Monday set the tone. The S&P 500 surged 1.1%, its best day since the war began February 28, after President Trump announced a delay in strikes on Iranian energy infrastructure. Brent crude tumbled roughly 11% below $100 a barrel, giving equity bulls the oxygen they needed. The Dow and Nasdaq each climbed 1.4%. That lasted about 36 hours. By Wednesday, the U.S. had delivered a 15-point peace proposal to Tehran, which produced another modest rally (+0.5% S&P, +0.7% Dow), but Iran’s swift public rejection crushed the momentum Thursday. The Nasdaq dropped 2.38% and officially entered correction territory, down more than 10% from its peak. The S&P 500 shed 1.74%. Trump then extended the “strike or open the Strait of Hormuz” deadline to April 6, calming futures Thursday night but doing little to arrest the broader trend on Friday.
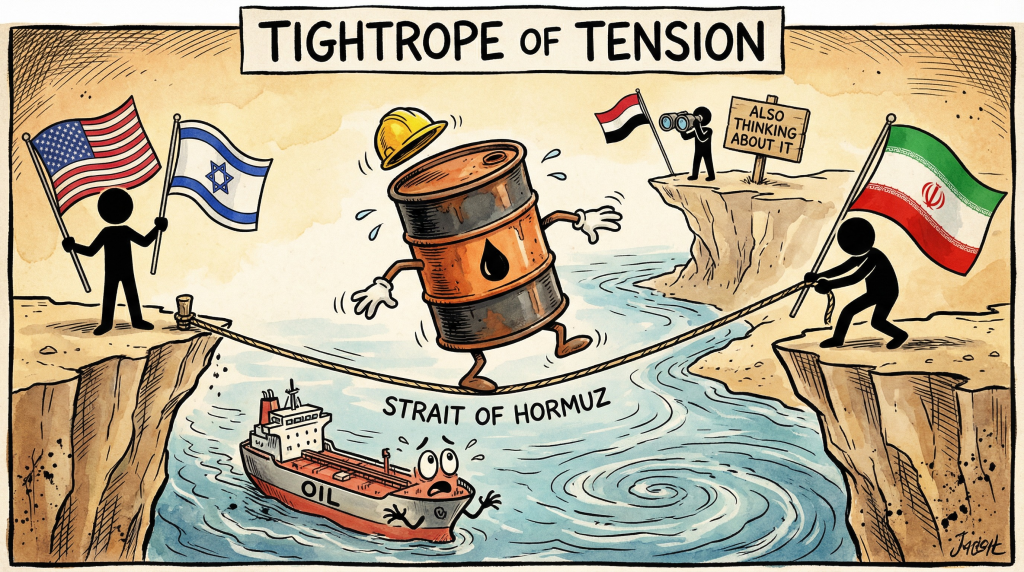
Bombs, Barrels, and the Bab al-Mandab — The Iran War’s Market Math
- Brent crude: ~$108/barrel Thursday (+5.7% on the day); WTI ~$94–98; oil up 30% month-over-month and ~25% year-over-year.
- Gold: whipsawed — hit $5,600 ATH in late January, now off ~20% from that peak to ~$4,430–4,543 range; safe-haven premium is contested as financialization distorts traditional hedging behavior.
The key takeaway – Day 27 of the Iran war, and the world’s energy plumbing is looking increasingly fragile. What began on February 28 with Operation Epic Fury, joint U.S.-Israeli airstrikes that killed Supreme Leader Khamenei and dismantled Iran’s air defense network, has metastasized into a multi-front regional conflict, with oil markets serving as the world’s real-time risk barometer.
The Strait of Hormuz is effectively closed to Iranian oil exports after the U.S. bombed Kharg Island, Iran’s primary oil export hub responsible for 90% of its exports. That alone removed roughly 1.5–2 million barrels per day from global supply. But this week raised the stakes further: Houthi leadership publicly declared it stands “fully militarily ready” to open a second chokepoint, the Bab al-Mandab Strait off Yemen’s coast, which controls seaborne traffic toward the Suez Canal. If that domino falls, a meaningful chunk of global oil and LNG trade gets rerouted around the Cape of Good Hope, adding weeks to transit times and real dollars to shipping costs. Markets are pricing in that tail risk.
Meanwhile, Trump issued a fresh ultimatum Thursday, open the Strait of Hormuz by April 6 or face strikes on Iran’s power grid, before extending the deadline overnight. Iran responded with a counterproposal demanding sovereignty recognition over the Strait, essentially a non-starter. Diplomatic back-channels remain open, but the war on the ground has not slowed: the U.S. has struck over 8,000 Iranian military targets, Iran hit Qatar’s LNG infrastructure, and Washington is weighing a deployment of up to 10,000 additional ground troops.
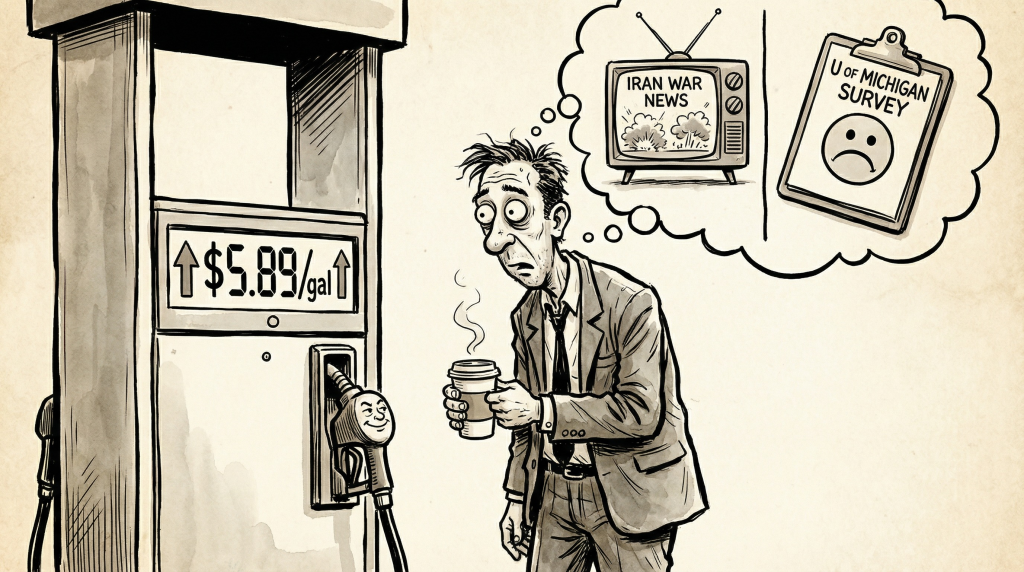
Feeling the Pump — Consumers Blink as Gas Prices and War Anxiety Collide
- Michigan Final March ICS: ~57 (final figure), preliminary was 55.5 vs. 56.6 in February; year-ago reading was 57.0.
- Year-ahead inflation expectations: 3.4% — ending six months of consecutive declines; well above the 2.3–3.0% pre-pandemic norm.
- Personal finance expectations: -7.5% nationally; Current Economic Conditions sub-index was the lone bright spot, rising to 57.8 from 56.6.
The key takeaway – The University of Michigan dropped its final March consumer sentiment reading this morning, and the number told a story that has been building since February 28: when $5 gas meets a war Americans are directly involved in, the vibe shifts fast. The final March Index of Consumer Sentiment came in weaker than even the already-soft preliminary reading of 55.5, with the headline index sliding toward levels not seen since late 2025, well below the historical average of ~85.
What makes this report particularly notable is the natural experiment baked into the survey design. Interviews were collected from February 17 through early March, roughly half before the U.S.-Israeli strikes on Iran began, half after. The pre-war cohort actually showed improving sentiment from February. The post-war cohort completely erased those gains and then some. Director Joanne Hsu noted that “gasoline prices have exerted the most immediate impact,” though the broader pass-through to other prices remains “highly uncertain”, which is economist for “we don’t know how bad this gets yet.” The most alarming sub-component: personal finance expectations fell 7.5% nationally, and the decline was broadly distributed across income levels, ages, and political affiliation. This isn’t partisan pessimism, it’s real-wallet anxiety.
On inflation expectations, the report snapped a six-month streak of declining readings. Year-ahead expectations stalled at 3.4%, while long-run expectations edged down marginally to 3.2%. Crucially, respondents who completed surveys after February 28 showed noticeably higher inflation expectations than pre-war respondents, the market is already pricing in gas-driven CPI pressure.
From Around the Watercooler

Musk rewrites IPO playbook with large slice of SpaceX stock for retail investors
Landmark L.A. jury verdict finds Instagram, YouTube were designed to addict kids
Google Shrinks AI Memory With No Accuracy Loss—But There’s a Catch
Netflix’s second price hike in just over a year
2026 March Madness: Men’s NCAA tournament schedule, dates
Disclousure:
Investing involves risk, including the possible loss of principal and fluctuation of value. Past performance is no guarantee of future results.
This newsletter is not intended to be relied upon as forecast, research or investment advice, and is not a recommendation, offer or solicitation to buy or sell any securities or to adopt any investment strategy. The opinions expressed are as of the date noted and may change as subsequent conditions vary. The information and opinions contained in this letter are derived from proprietary and nonproprietary sources deemed by Waterloo Capital to be reliable. The letter may contain “forward-looking” information that is not purely historical in nature. Such information may include, among other things, projection, and forecasts. There is no guarantee that any forecast made will materialize. Reliance upon information in this letter is at sole discretion of the reader. Please consult with a Waterloo Capital financial advisor to ensure that any contemplated transaction in any securities or investment strategy mentioned in this newsletter aligns with your overall investment goals, objectives and tolerance for risk. Additional information about Waterloo Capital is available in its current disclosure documents, Form ADV, Form ADV Part 2A Brochure, and Client Relationship Summary report which are accessible online via the SEC’s investment Adviser Public Disclosure (IAPD) database at www.adviserinfo.sec.gov, using SEC # 133705. Waterloo Capital is neither an attorney nor an accountant, and no portion of this content should be interpreted as legal, accounting or tax advice.