
S&P 500: -1.60% DOW: -1.99% NASDAQ: -1.26% 10-YR Yield: 4.28%
What Happened?
Markets spent the week trading like a tug-of-war between geopolitics and “just good enough” macro data. Early in the week, crude spiked on escalating U.S.-Iran tensions and worries about shipping disruptions, and that rippled straight into risk assets. Energy stocks caught a bid as oil surged past $100 briefly, but broader equities struggled to find their footing, with the Dow bearing the brunt of the selling as investors rotated away from rate-sensitive industrial and consumer names and into more defensive havens. Midweek brought one of the ugliest intraday tapes of the year, with the Dow down over 700 points at the lows and the S&P flirting with its 50-day moving average as crude jumped and inflation fears resurfaced. By Friday, some of that pressure finally eased as oil backed off the highs, allowing the S&P to stage a relief rally and claw back part of the week’s losses. The end result was a choppy, sector-driven week where headline indices masked significant rotation underneath the surface.
Sector leadership told the real story. Energy moved to the front of the pack as investors priced in a higher and stickier input-cost backdrop, though the sector’s 1% weekly gain looked modest compared to crude’s 35% spike earlier in the period. Traditional defensives like Healthcare and Consumer Staples held their ground, with Healthcare gaining 1% as billions flowed into low-beta assets amid the geopolitical storm. Growth and duration-sensitive corners saw more two-way action. Big Tech snapped back on some days as yields drifted lower around the in-line CPI print, then gave up ground again when oil headlines re-ignited inflation risk. Small caps continued to outperform on relative terms, helped by cyclicals and domestically focused names that look less exposed to tariff and global growth crosscurrents. Taken together, this week extended the broadening-out theme. Major indices are no longer trading as a pure mega-cap AI proxy but are instead weighing oil volatility, war risk, steady but not collapsing inflation, and a labor market that is cooling at the edges without breaking.
KConsumer prices rose 2.4% annually in February, as expected
- Headline CPI: 0.3% month over month and 2.4% year over year in February, unchanged from January’s annual rate.
- Core CPI: 0.2% month over month and 2.5% year over year, also flat versus January.
- Key drivers: shelter +0.2%, food +0.4%, energy +0.6% on the month, with tariffs and oil cited as ongoing cost pressures.
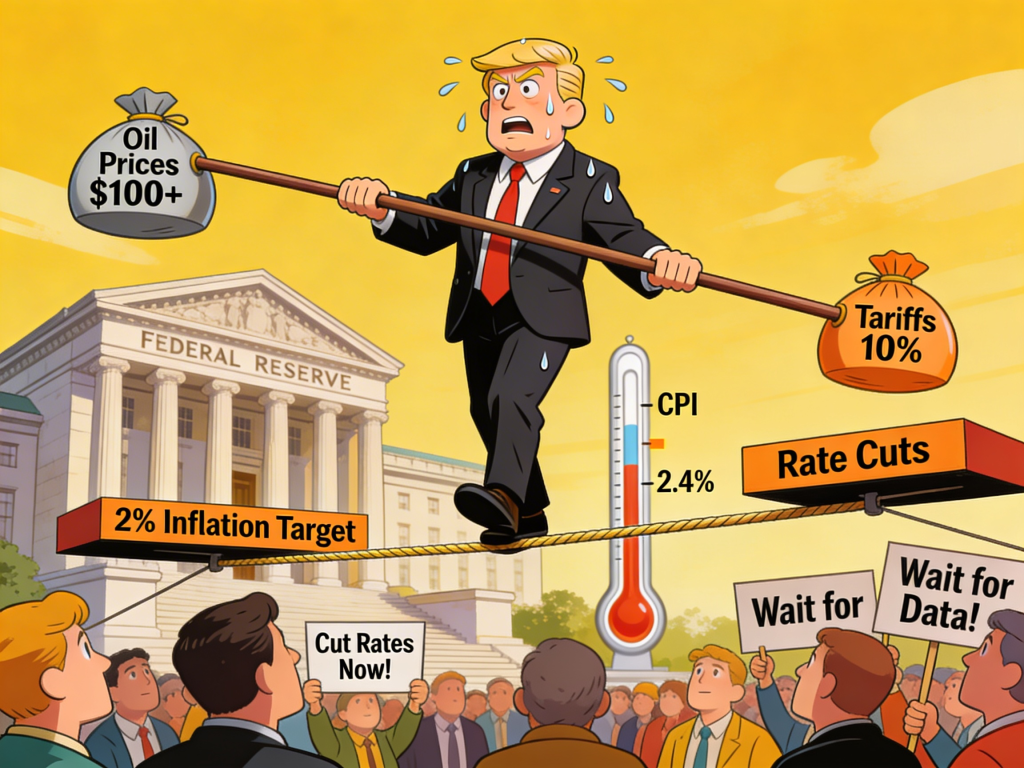
The key takeaway – February’s CPI report landed like a well-telegraphed plot twist. Headline inflation rose 0.3% month over month and 2.4% over the past year, exactly matching expectations and holding steady versus January’s 2.4% pace. Core CPI, which strips out food and energy, came in at 0.2% on the month and 2.5% year over year, also essentially unchanged. Shelter once again did most of the heavy lifting on the monthly gain, with the shelter index up 0.2%, while food prices rose 0.4% and energy climbed 0.6%. In other words, this was not an inflation scare, but it also was not the clean disinflation victory the Fed would like to see before committing to deeper cuts. Against that backdrop, many on the Street framed the print as “just good enough” to keep rate-cut hopes alive later in the year, but not so soft that policymakers feel rushed.
The complicating factor is everything happening outside that tidy CPI table. Trump’s new global tariff regime is still feeding through to goods prices, with recent analysis noting that effective tariff burdens remain elevated compared with pre-trade-war norms, limiting how much relief households really feel. Oil’s latest spike adds another layer of uncertainty, since a sustained move higher in crude tends to bleed into headline CPI with a lag through gasoline and transportation costs. That combination helps explain why markets treated the CPI release as a modest positive, but not a green light for a “cuts are coming soon” party. The macro read-through: inflation is contained enough to avoid a renewed tightening cycle, yet sticky enough that the Fed can stick with patience, keeping rate-cut odds tied to future oil and tariff developments rather than this one benign print.
Jobless Claims Decline Slightly Amid Mixed Labor Signals in March 2026
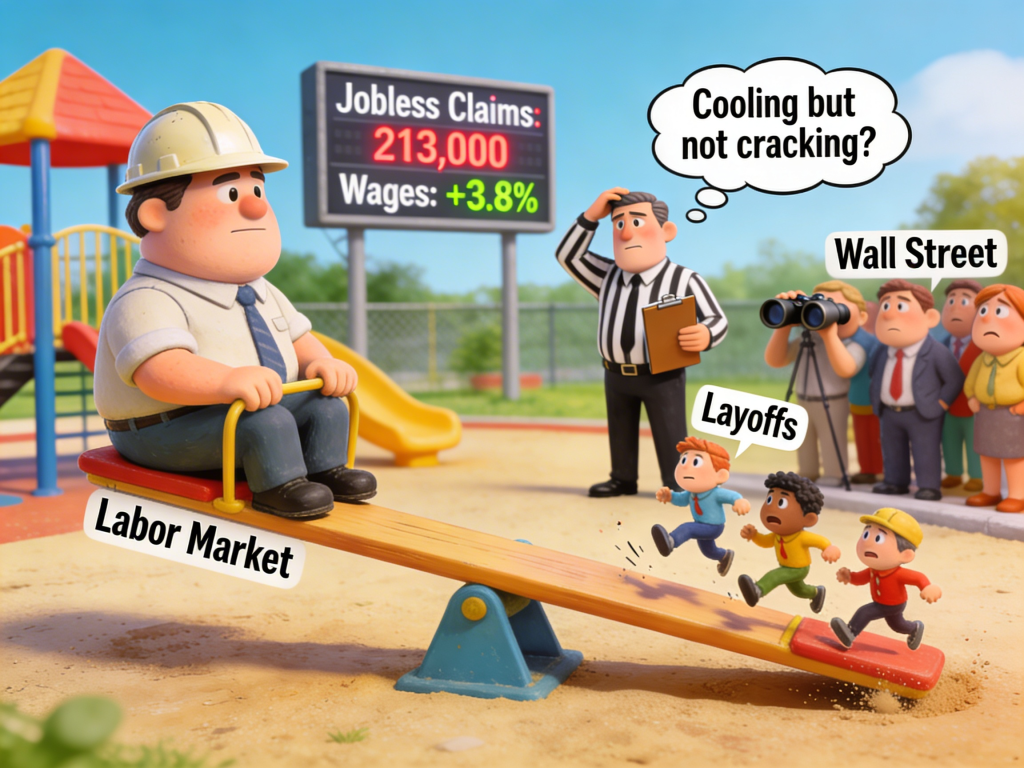
- Weekly initial jobless claims: 213,000 vs 215,000 expected, four-week average 212,000, signaling low layoffs.
- February wages: average hourly earnings up 0.4% month over month and 3.8% year over year, both a bit above forecasts.
- Message to markets: labor is cooling gradually, supporting soft-landing hopes while keeping the Fed cautious on the pace of cuts.
The key takeaway – Labor data this week continued the recent theme of “slower, not shattered.” Fresh numbers from the Labor Department showed initial claims for unemployment insurance at 213,000 for the week ended March 7, slightly below the 215,000 economists expected and down from a revised 214,000 the week prior. The four-week moving average sat at 212,000, underscoring how low layoffs remain by historical standards. That is noteworthy given February’s earlier payroll report, which registered softer job growth and a tick-up in the unemployment rate but also delivered firmer wage gains. Average hourly earnings rose 0.4% on the month and 3.8% year over year, both a touch hotter than forecast, hinting that wage inflation is cooling gradually rather than collapsing. Together, those signals suggest companies are slowing net hiring but are still reluctant to shed workers en masse, a classic late-cycle pattern rather than a sudden freeze.
For markets and the Fed, the nuance matters. A labor market that is “less hot” without being “truly cold” takes some urgency out of recession narratives while also reducing pressure on policymakers to slash rates preemptively. Equity traders read the steady claims figures as confirmation that recent volatility is being driven more by oil, tariffs, and geopolitics than by an abrupt domestic demand shock. At the same time, wage growth near 3.8% keeps a mild bid under the services side of inflation, reinforcing the idea that getting from the current 2.4 to 2.5% CPI and core readings to the Fed’s 2% target will be a grind, not a straight line. The tightrope image still fits: the job market is easing off the boil just enough to support the soft-landing story, but any renewed oil spike or tariff escalation could push that balance in a hurry.
From Around the Watercooler

America’s Strategic Oil Exports
Cuba Acknowledges Negotiations With Washington
More Marines and Warships Head to Middle East as Hormuz Mission Intensifies
U.S. Air Force Refueling Plane Crashes in Iraq
Disclousure:
Investing involves risk, including the possible loss of principal and fluctuation of value. Past performance is no guarantee of future results.
This newsletter is not intended to be relied upon as forecast, research or investment advice, and is not a recommendation, offer or solicitation to buy or sell any securities or to adopt any investment strategy. The opinions expressed are as of the date noted and may change as subsequent conditions vary. The information and opinions contained in this letter are derived from proprietary and nonproprietary sources deemed by Waterloo Capital to be reliable. The letter may contain “forward-looking” information that is not purely historical in nature. Such information may include, among other things, projection, and forecasts. There is no guarantee that any forecast made will materialize. Reliance upon information in this letter is at sole discretion of the reader. Please consult with a Waterloo Capital financial advisor to ensure that any contemplated transaction in any securities or investment strategy mentioned in this newsletter aligns with your overall investment goals, objectives and tolerance for risk. Additional information about Waterloo Capital is available in its current disclosure documents, Form ADV, Form ADV Part 2A Brochure, and Client Relationship Summary report which are accessible online via the SEC’s investment Adviser Public Disclosure (IAPD) database at www.adviserinfo.sec.gov, using SEC # 133705. Waterloo Capital is neither an attorney nor an accountant, and no portion of this content should be interpreted as legal, accounting or tax advice.