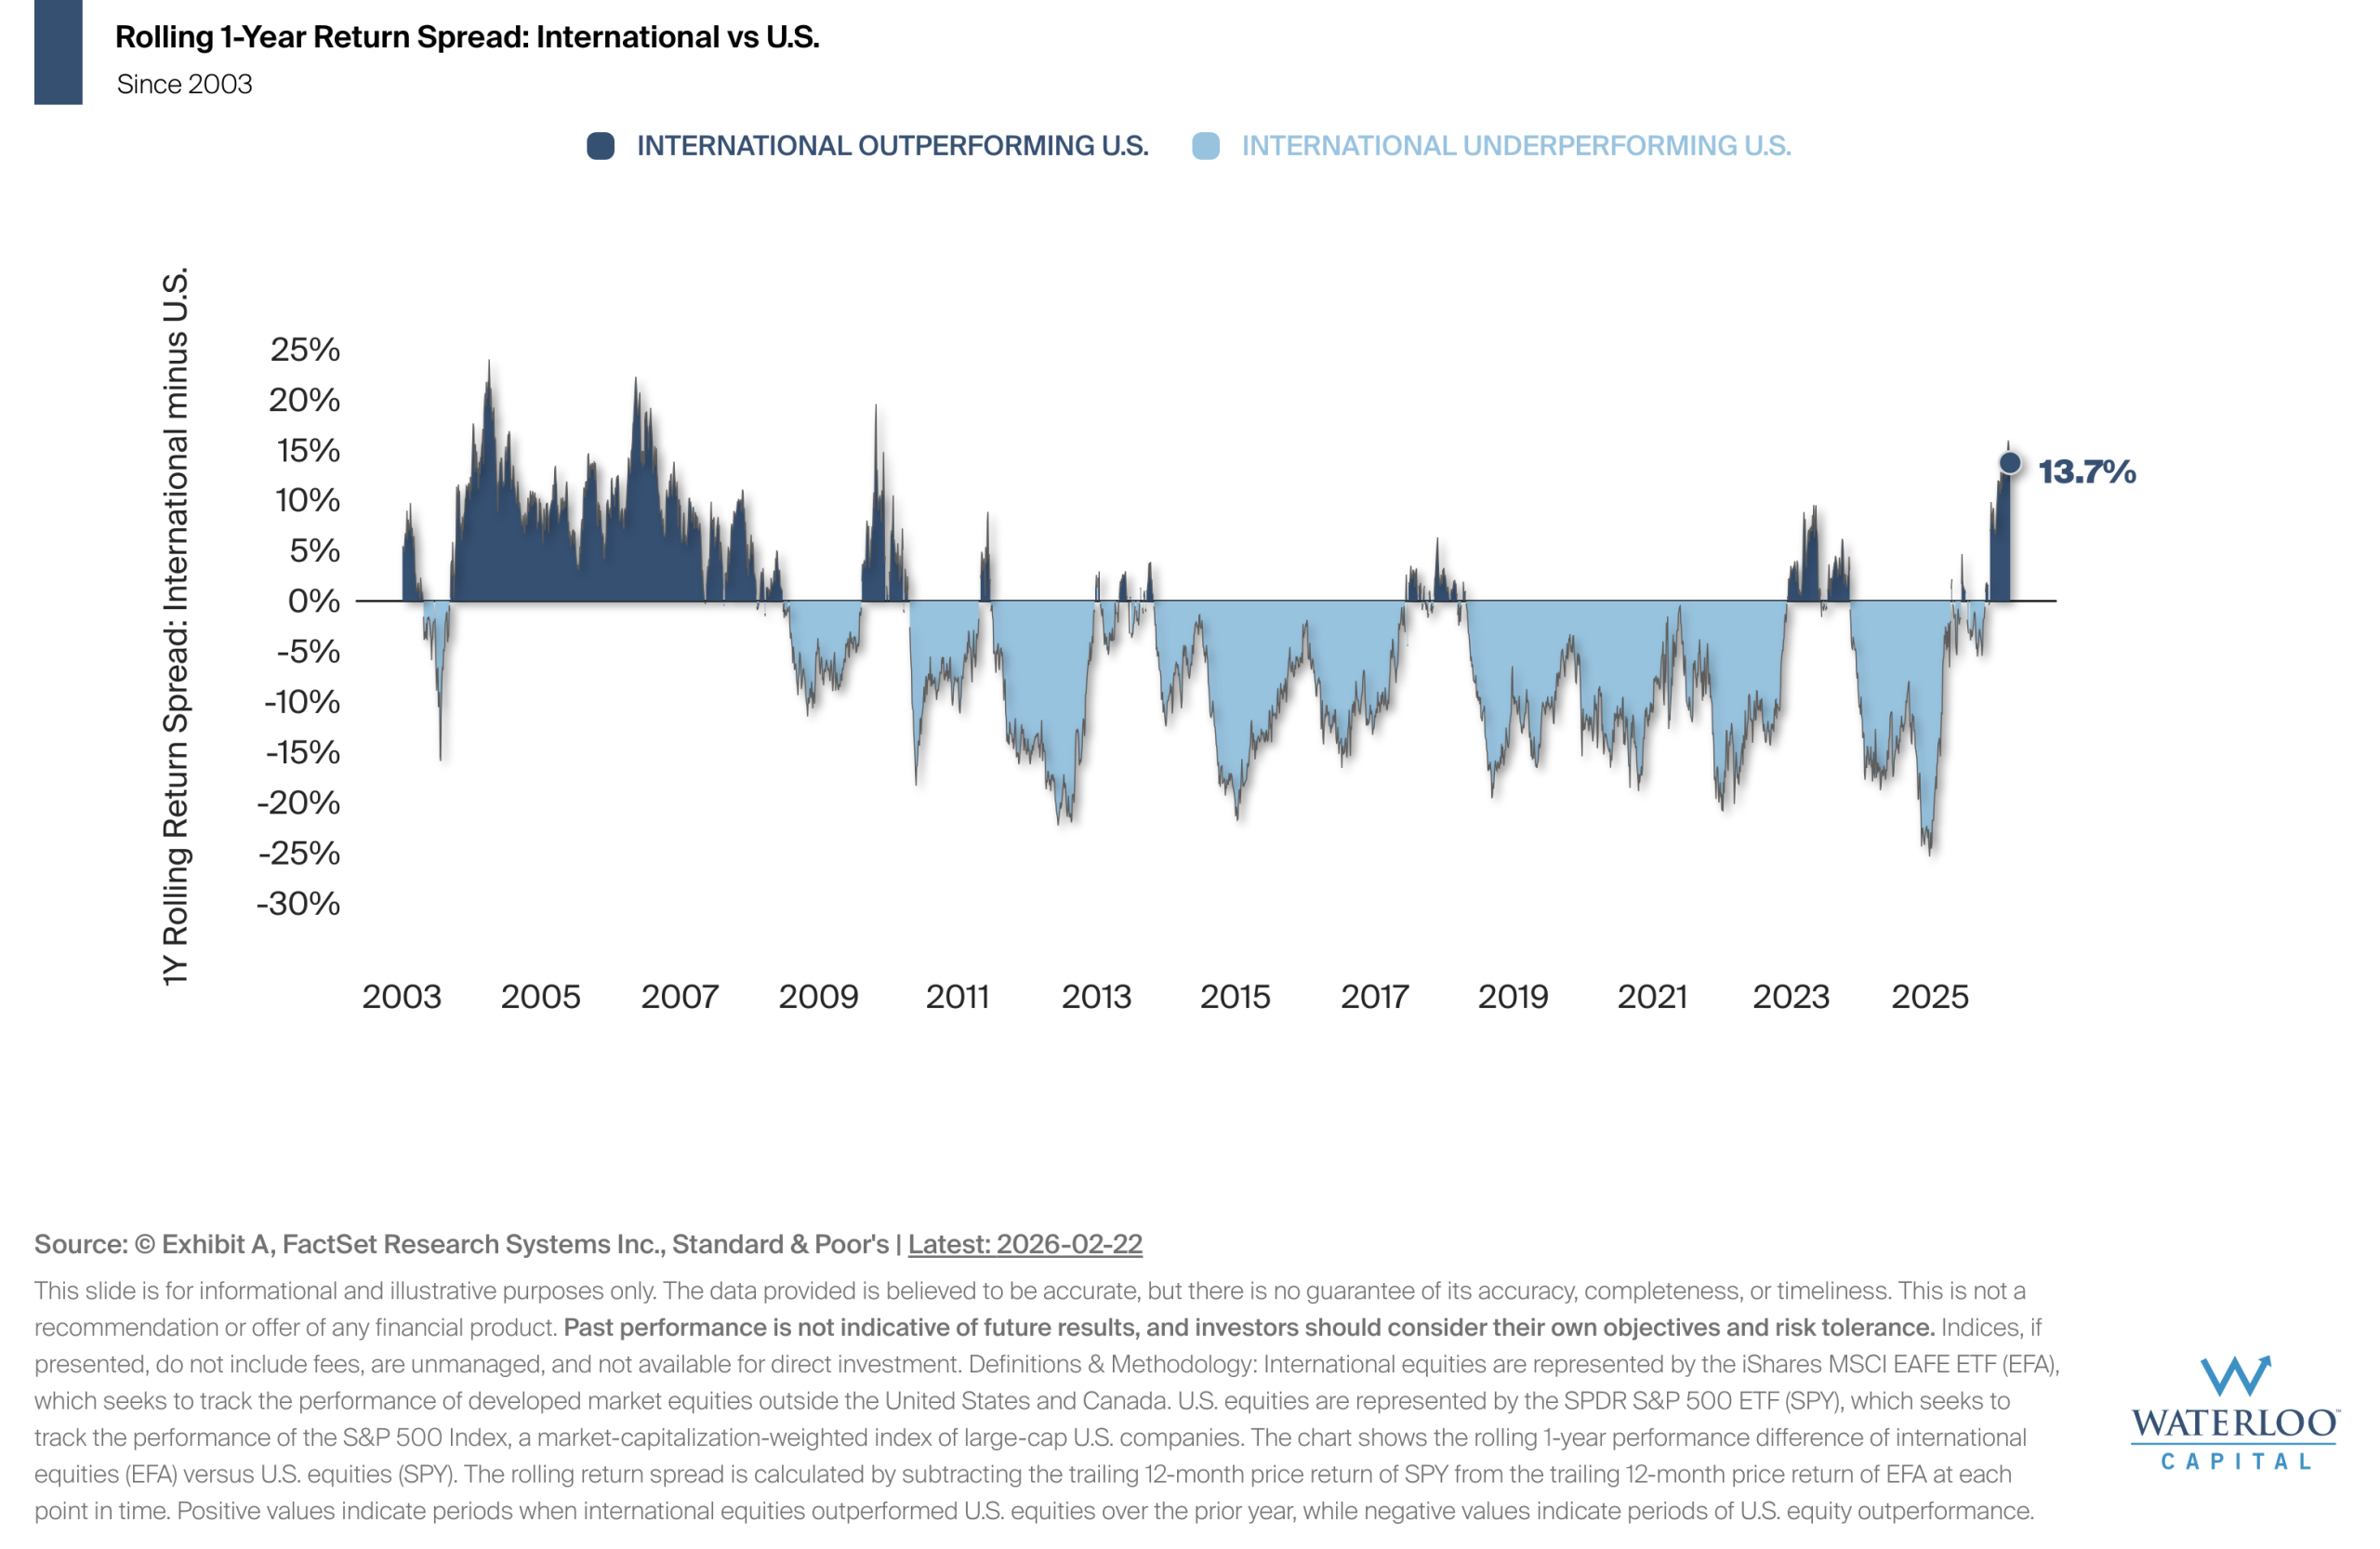

The chart illustrates the rolling one year performance spread between international and U.S. equities since the early 2000s. Positive periods indicate times when international stocks outperformed U.S. stocks over the prior year, while negative periods reflect periods of International underperformance.
The performance spread between international stocks and U.S. stocks over the past year is 13.7%.
The observed shifts in relative performance highlight how leadership between regions has varied over time. These rotations underscore that relative returns across global equity markets can change across different market environments rather than remain consistently concentrated in a single region.