Source: Bloomberg, Waterloo Capital, Data as of Sept. 12, 2025
Conversations about inflation are everywhere. From news headlines to dinner table chatter, the cost of everyday goods has become as much a part of daily life as the goods themselves. With that in mind, we thought it fitting to touch on the latest Consumer Price Index (CPI) report in our chart of the week.
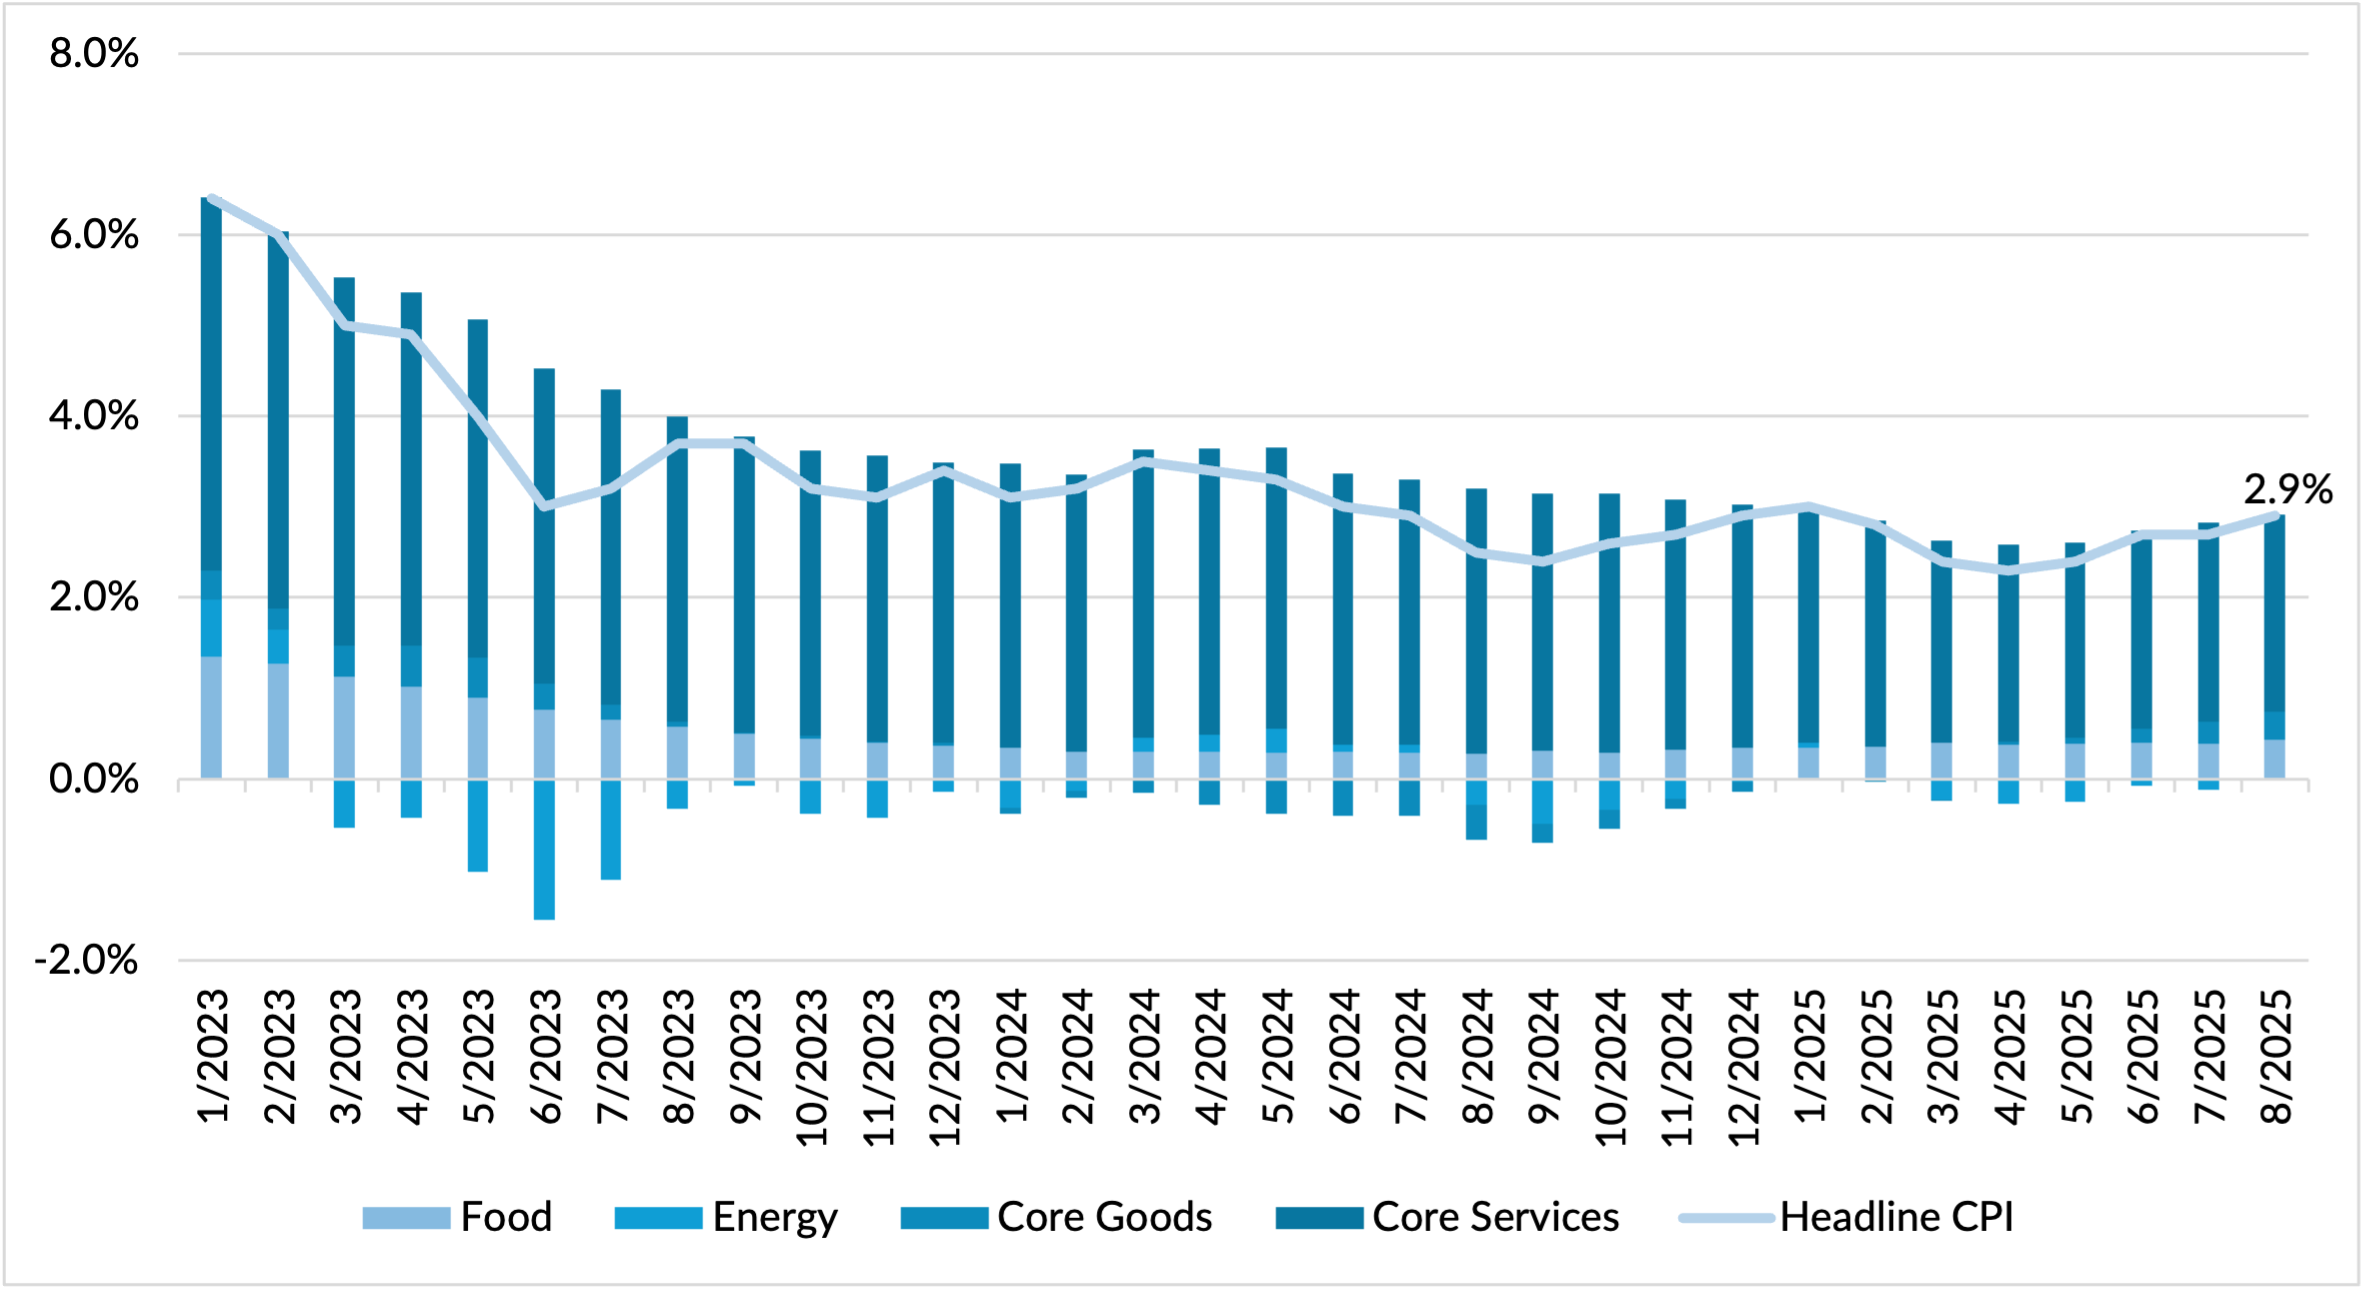
The illustration here highlights headline inflation since the start of 2023, along with the contributions of its four primary components: food, energy, core goods, and core services. After a promising start to 2025, when inflation trended lower through the first few months, we’ve seen it edge higher in recent readings making its way back to 2.9% in August. Beneath the surface, core services remain the biggest driver, with rents continuing to play an outsized role in the inflation consumers are experiencing.
For markets, this rebound matters because progress on inflation has been central to the expectation that the Federal Reserve will make relatively substantial cuts to interest rates in the coming months. Softer prints earlier this year bolstered that expectation. Now, however, the chart paints a more complicated picture. If the recent uptrend holds, the Fed will find it harder to deliver the scale of cuts markets are currently pricing in. Fewer cuts mean tighter financial conditions and adverse stock pricing dynamics which could make the bulls question their unimpeded rally.