
The Volatility Index (VIX) is a widely used measure of market volatility, often referred to as the “fear gauge.” It represents investor expectations for short-term volatility, derived from the prices of S&P 500 options. 500. A high VIX typically indicates increased market uncertainty, while a lower VIX suggests calmer market conditions. The VIX tends to spike during periods of significant market stress or sharp price movements.
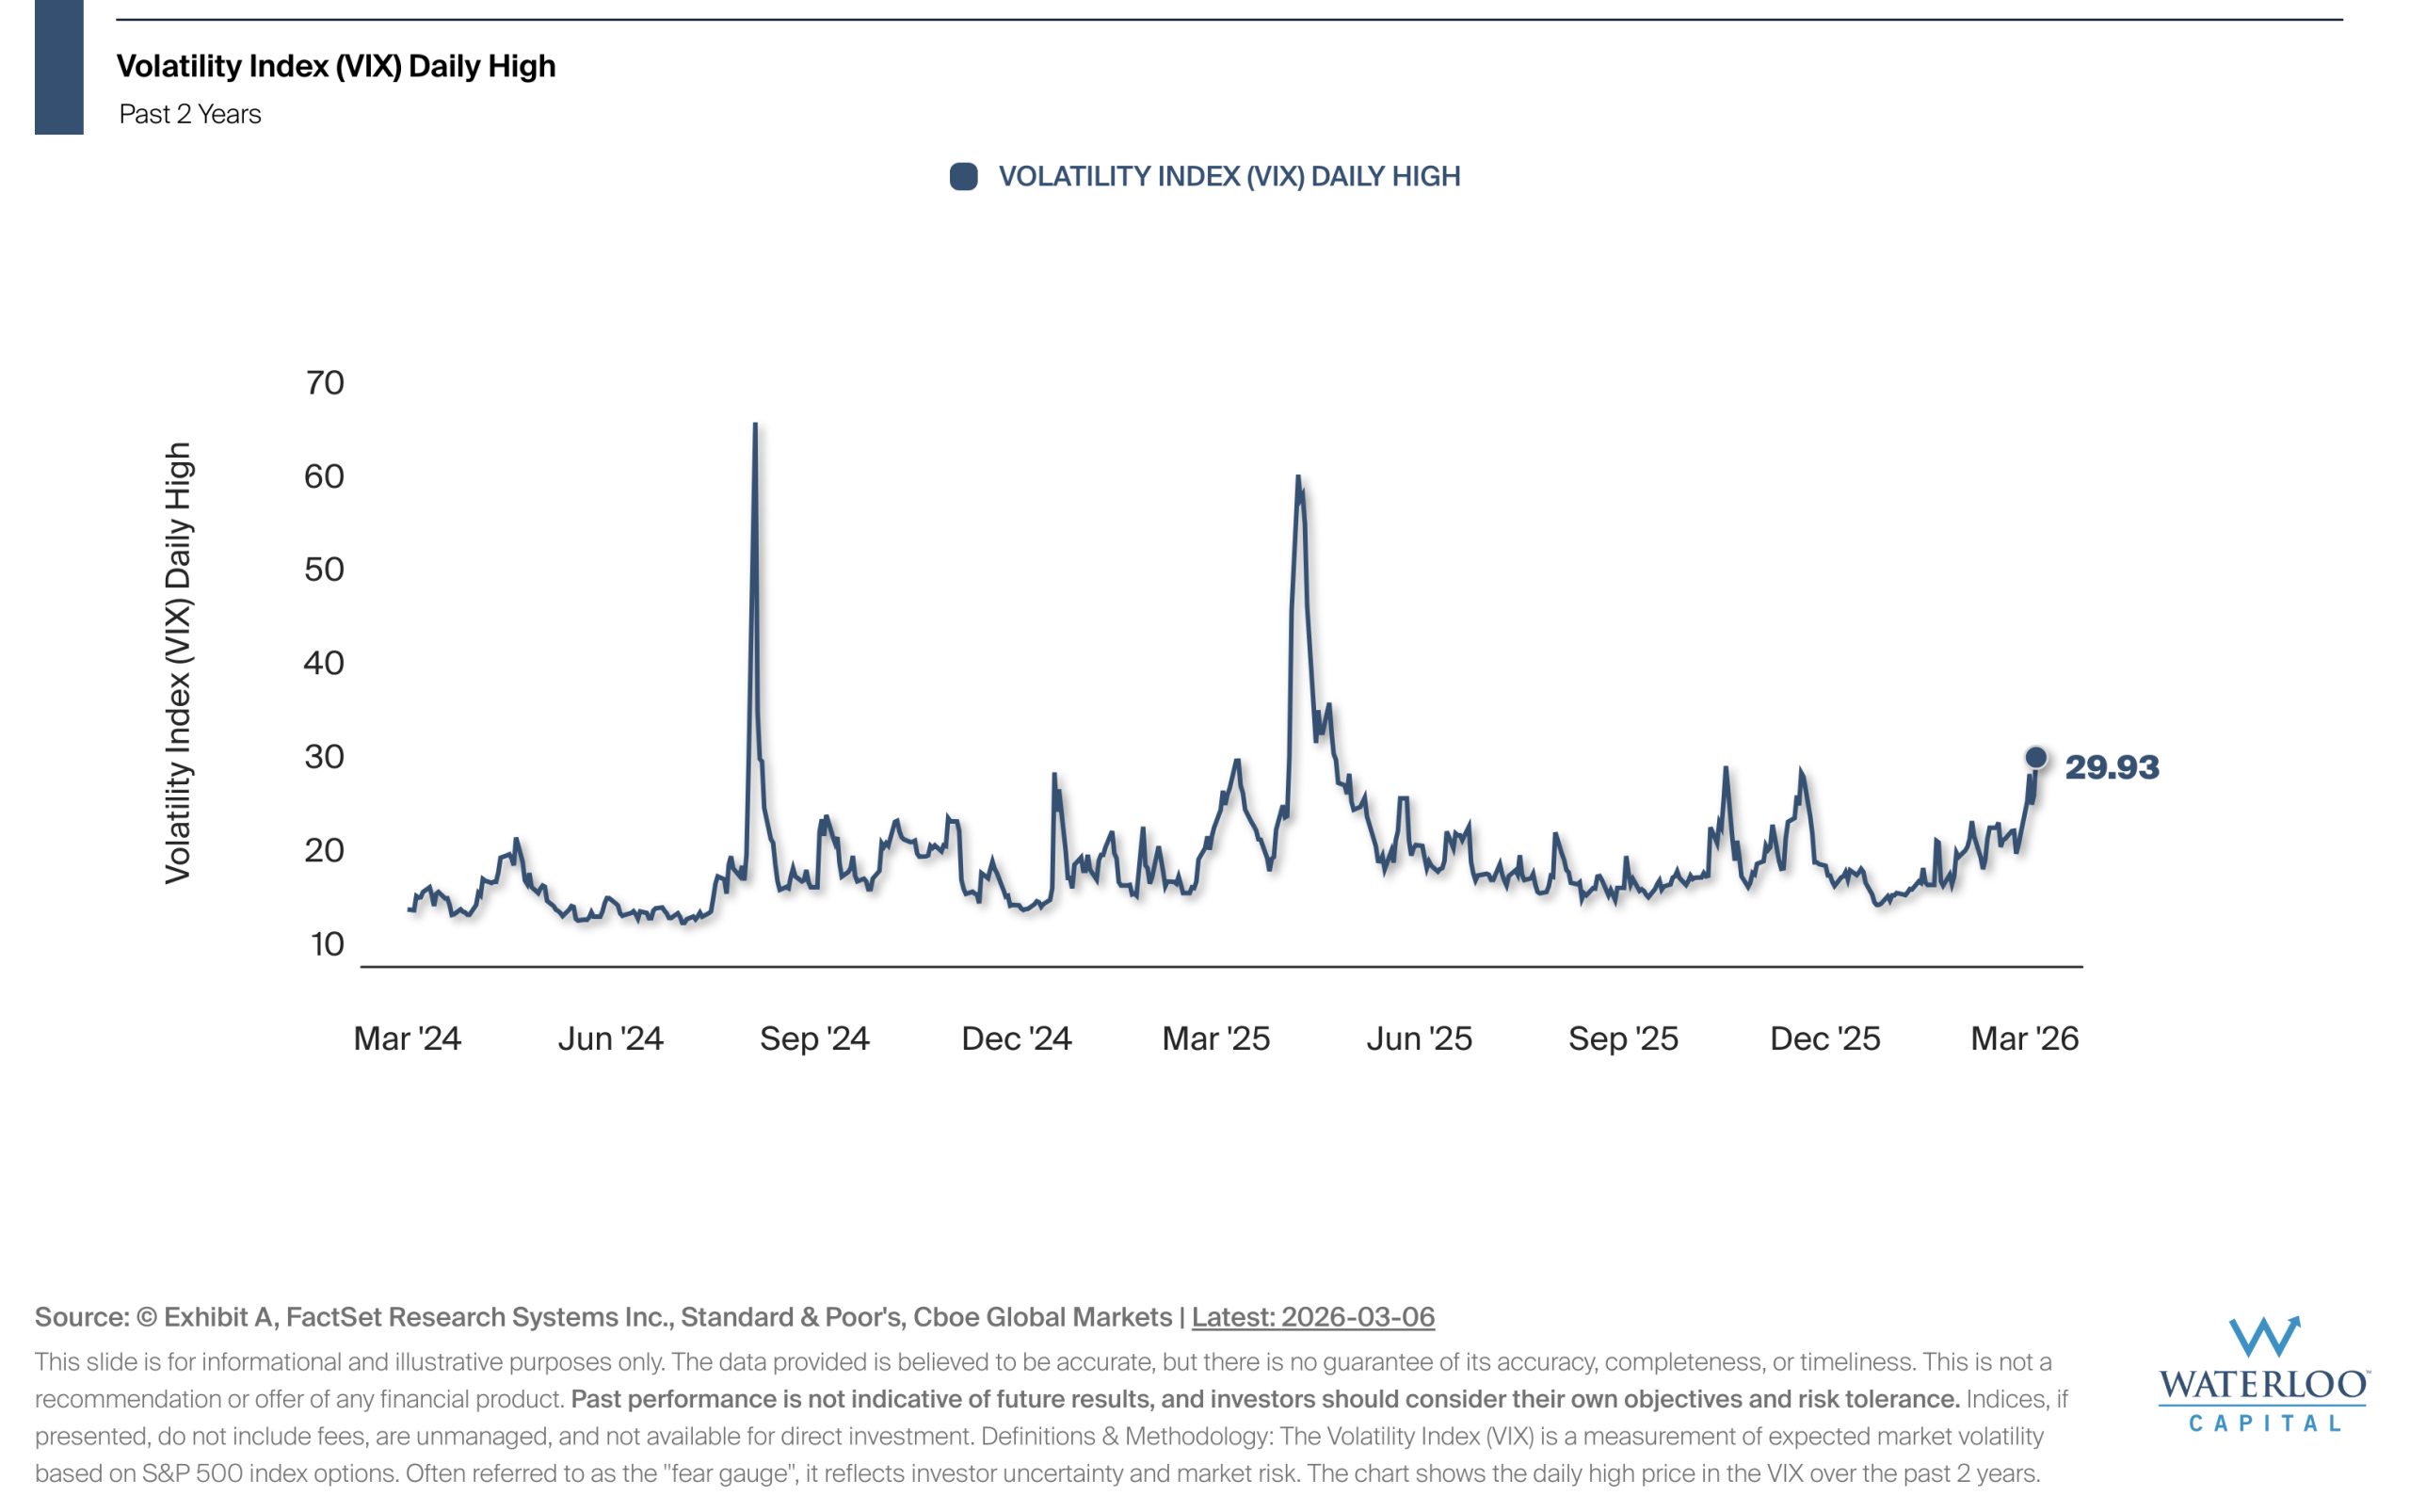
The chart tracks the daily high readings of the VIX over the past two years, capturing fluctuations in market volatility during that time. On March 6, 2026, the VIX hit a daily high of 29.93.
The VIX provides valuable insights into market sentiment and short-term risk. While a high VIX often signals increased volatility, it can also present opportunities for long-term investors who are focused on the long-term.