
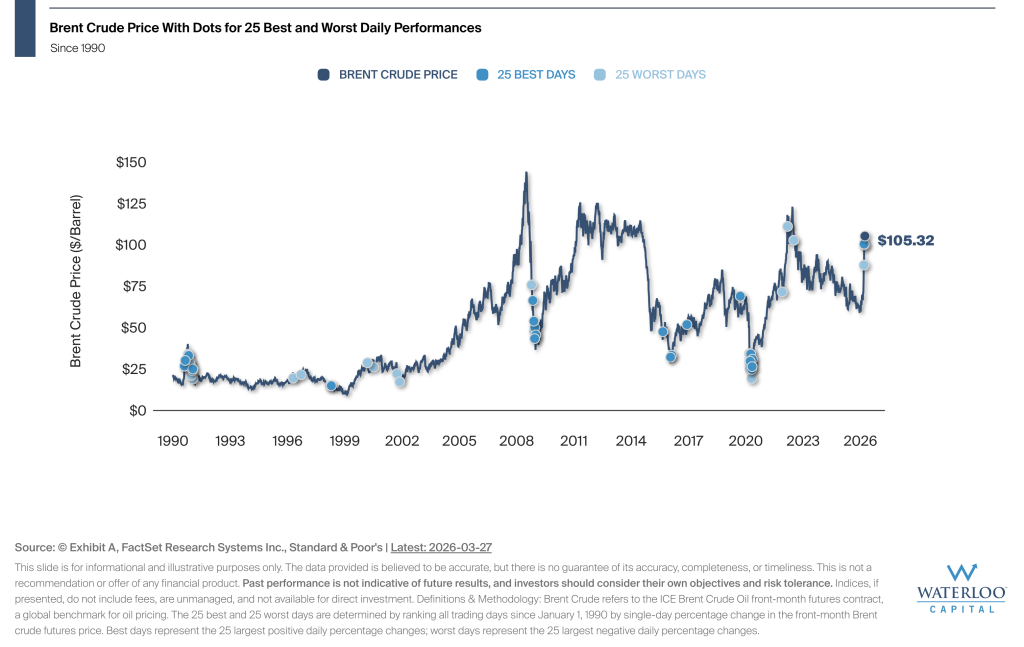
This chart plots the daily price of Brent crude oil since 1990 and highlights the 25 best and 25 worst single day percentage moves. Rather than being spread evenly across time, these extreme days have historically tended to cluster together during periods of heightened uncertainty.
The largest single day moves, both up and down, have historically concentrated around major dislocations like the 2008 financial crisis, the 2014-2016 oil price collapse, and the 2020 pandemic. Many of the best days occurred during or immediately after sharp drawdowns, not during calm markets.
While Brent crude oil has seen some of its largest single day gains during recent periods of volatility, history suggests caution. The best and worst days have historically occurred in close proximity to one another, meaning large up days have often been accompanied by large down days shortly before or after. Past performance is not indicative of future results.