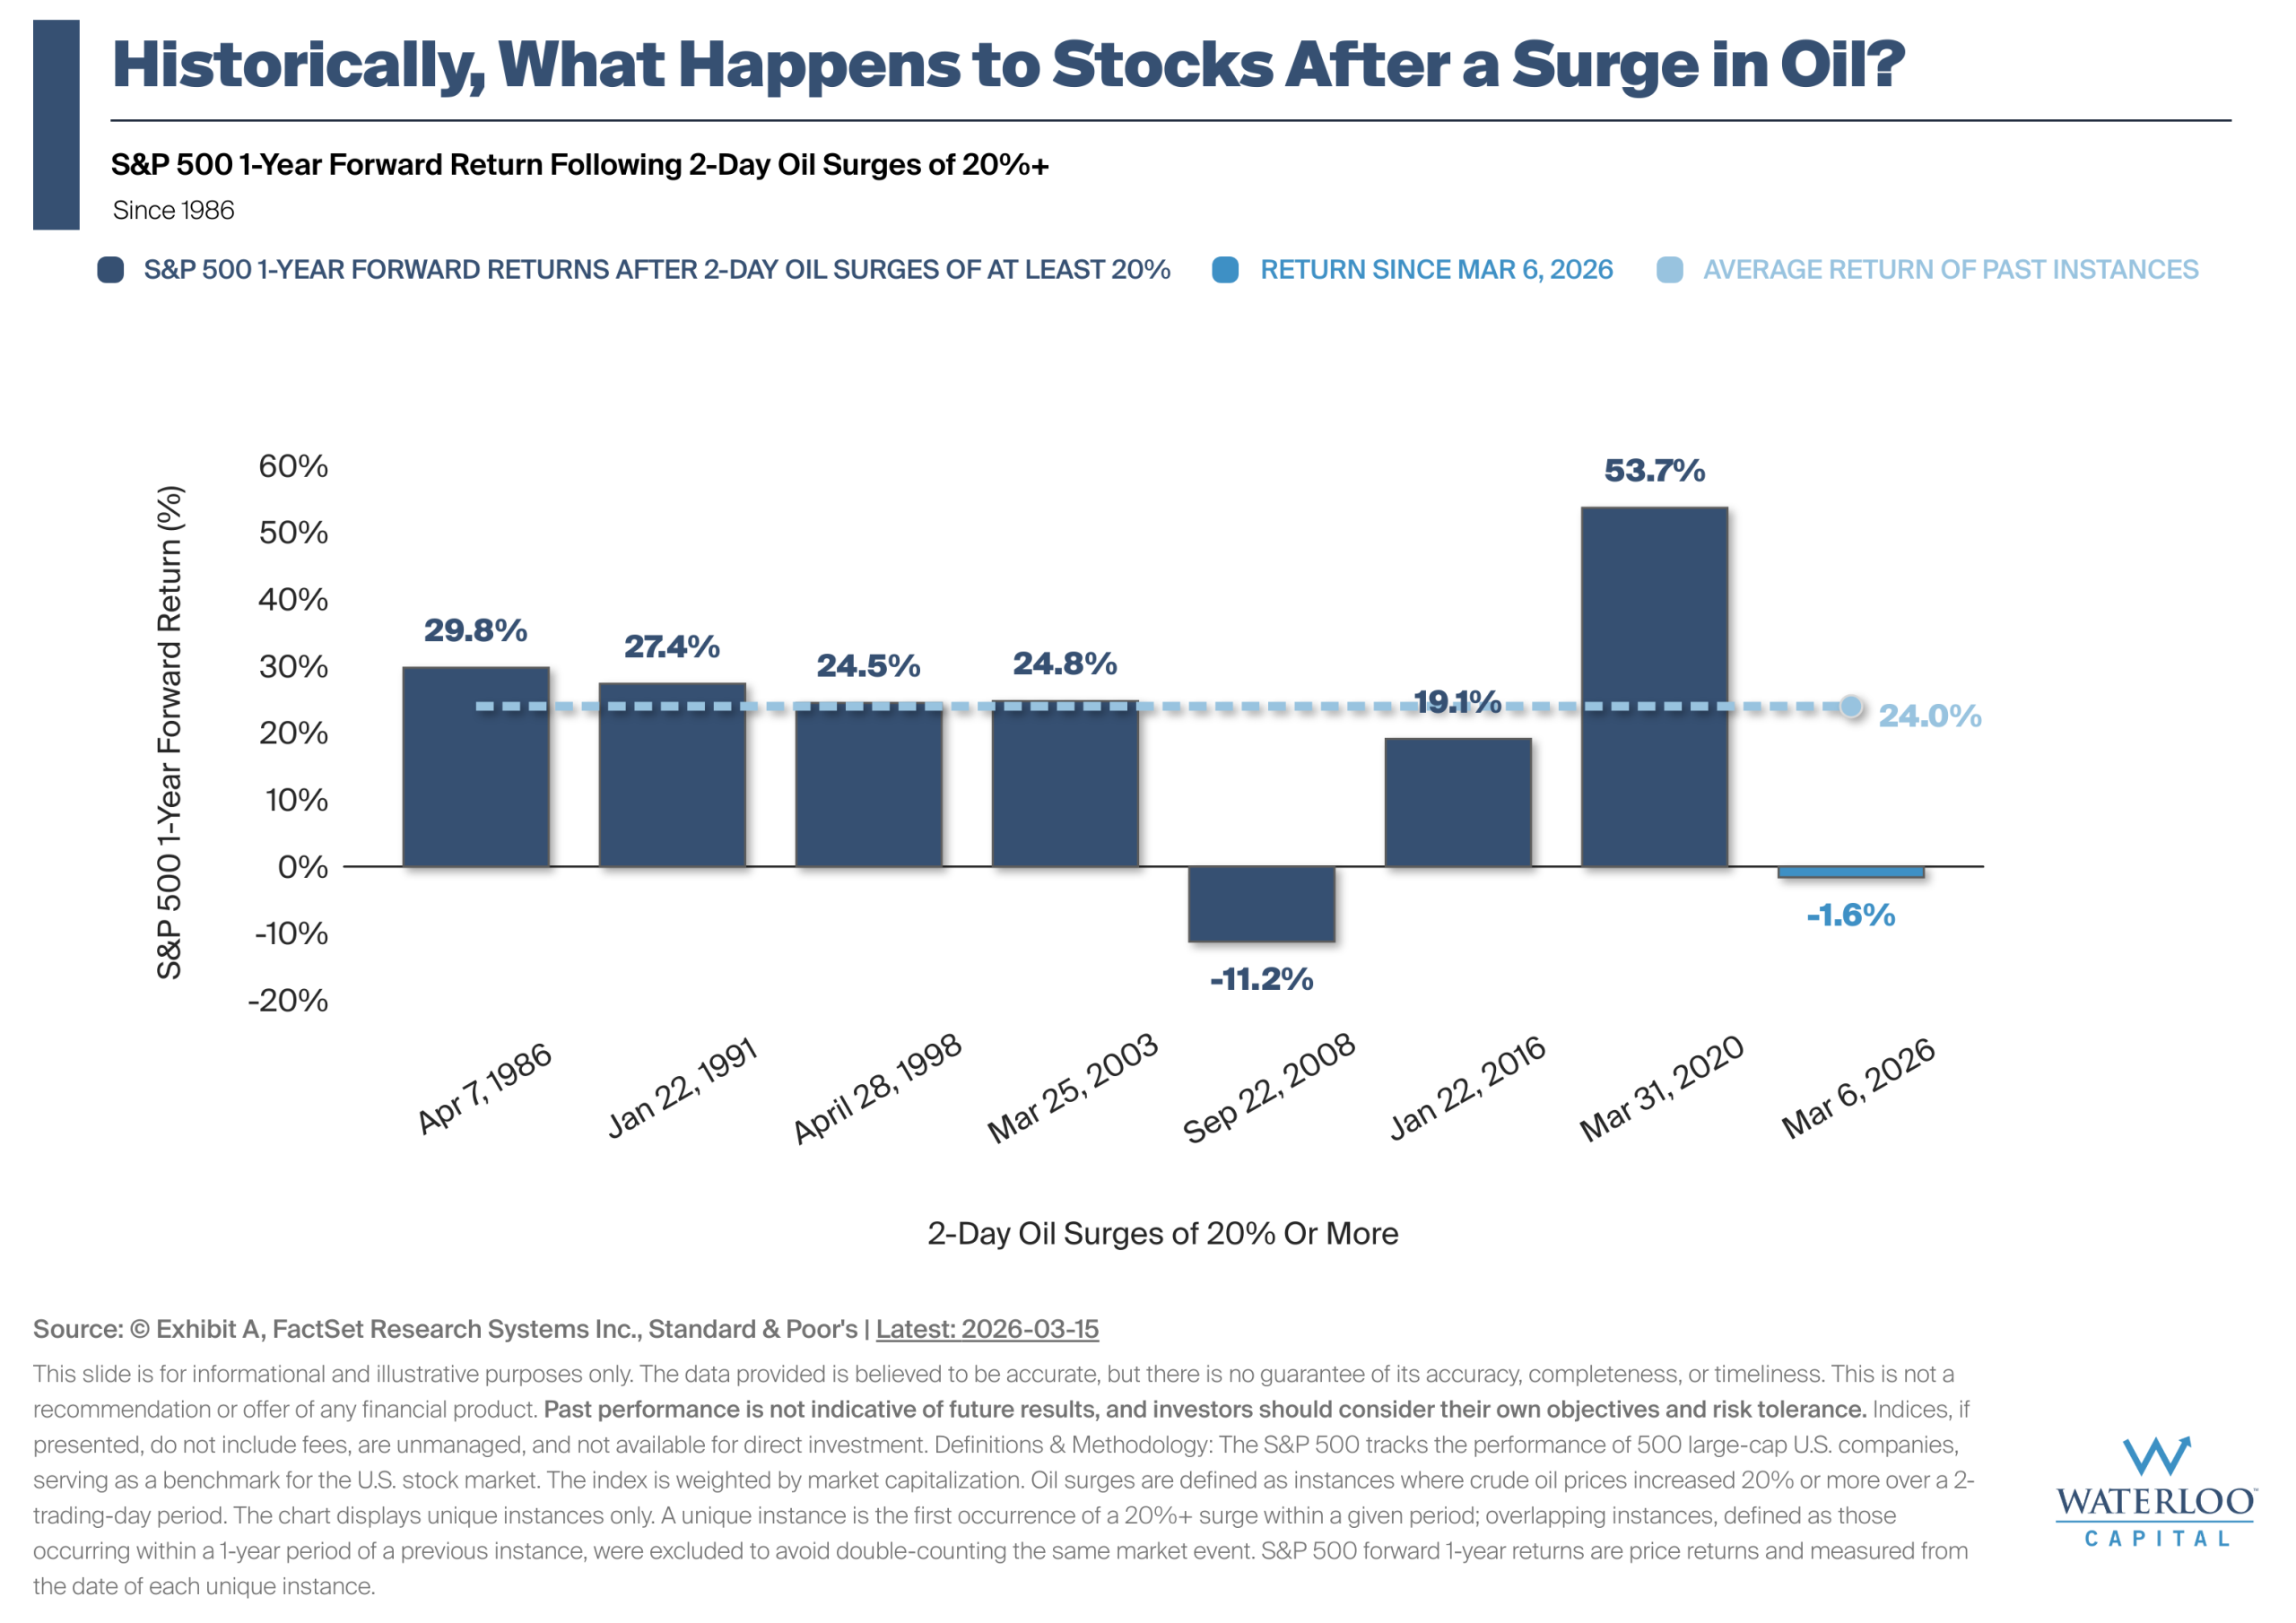

Measuring Oil Surges & Stock Returns: The chart illustrates how the S&P 500 has historically performed over the following year after 2-day oil price surges of 20% or more, dating back to 1986.
A Look at the Data: There have been 8 unique instances of oil surging 20% or more over a 2-day period (since 1986). In 7 of 8 cases, the S&P 500 was higher one year later. The S&P 500 has generated a -1.60% return since the March 6, 2026 instance.
Investment Implications: While past performance is not indicative of future results, the chart shows that the S&P 500 has historically tended to show resilience the year following 2-day oil surges over more than 20%.