
MARKET COMMENTARY
The U.S. and Israel’s coordinated strikes on Iran over the weekend, and Iran’s retaliatory attacks, have pushed geopolitics back to the forefront for markets, with oil jumping roughly 8–10% and traders suddenly repricing the risk of disruptions near the Strait of Hormuz. The Strait of Hormuz is a critical waterway where more than 20% of the global supply of oil passes through, which if cut off could halt oil transportation and raise prices. A sustained move higher in crude would not only show up at the gas pump, but could also complicate the already delicate inflation picture that investors have been watching.
This week’s key data, including ISM manufacturing and services and Friday’s February jobs report, will help show whether the economy’s recent strength is holding up after last month’s positive figures. ISM readings are expected to hover near modest expansion, while economists see payroll gains slowing to around 60,000 with unemployment holding near 4.3–4.4%, and the backdrop of rising AI related job fears adding a new layer of uncertainty to each labor release. On the corporate side, earnings from Target, Costco, and Kroger should give a timely read on the consumer, from big box discretionary spending to membership club and grocery trends.
Technically, market participation has broadened beyond the mega cap growth leaders, with equal weight and mid cap indexes looking healthier. However, the sectors picking up leadership, such as industrials, energy, and select defensives, do not carry the same market cap weight, so their outperformance under the surface isn’t as apparent at the benchmark level. At the same time, the recent software sell off highlights how concentrated the pressure has been in some of the largest growth names, which still exert an outsized pull on index performance. That mix makes a stronger case for active management, since simply holding a cap weighted index leaves investors dominated by underperforming giants, while a more selective approach can pull capital from the heaviest, weaker sectors and reallocate toward smaller areas where fundamentals and relative strength are quietly improving.
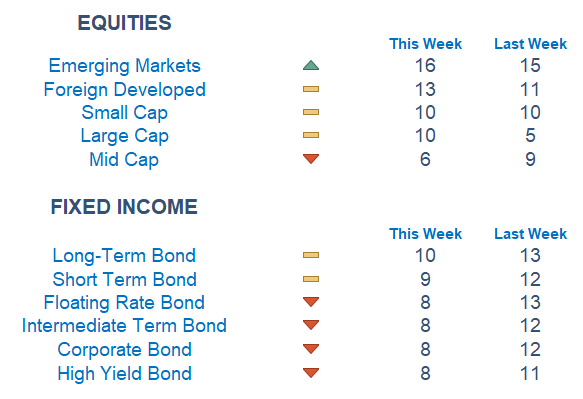
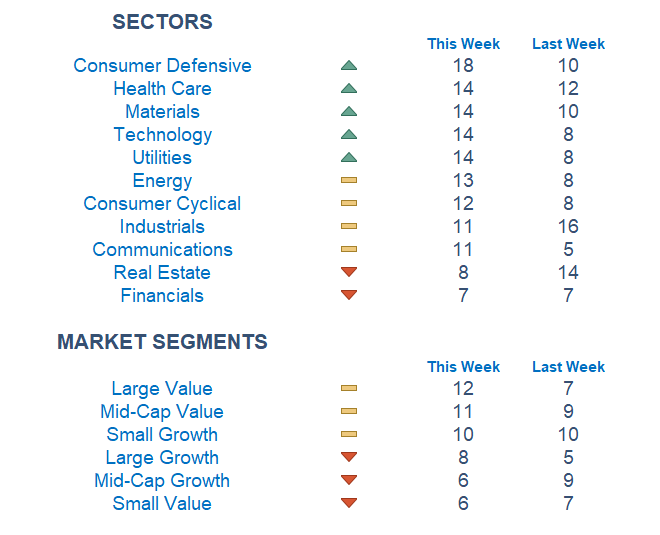
Our Newton model is looking brighter this week, with improvement across most areas of the market. Markets outside the U.S. remain in the lead, while bonds look less favorable than they did a week ago. At the sector level, recent laggards such as Health Care and Technology are starting to firm up, Consumer Defensive has moved higher in our rankings, and Real Estate has slipped. Value is back ontop, with large and mid cap value standing out as the most attractive segments.
Economic Releases This Week
Monday: ISM Manufacturing
Tuesday: None
Wednesday: ISM Services
Thursday: Initial Jobless Claims
Friday: Unemployment Report
Stories to Start the Week
How the attack on Iran could impact the global oil market and economy
Iran war prediction market bets draw heat: ‘Insane this is legal’
FBI investigates Texas bar shooting that killed 2 and wounded 14 as possible terrorist act
How talks between Anthropic and the Defense Department fell apart
Berkshire’s new CEO lays out how he will pick up where the Buffett era left off

Our Newton model attempts to determine the highest probability of future price direction by using advanced algorithmic and high-order mathematical techniques onthe current market environment to identify trends in underlying security prices. The Newton model scores securities over multiple time periods on a scale of 0-20 with 0 being the worst and 20 being the best possible score.
Trend & level both matter. For example, a name that moves from an 18 to a 16 would signal a strong level yet slight exhaustion in the trend.
Technical trading models are mathematically driven based upon historical data and trends of domestic and foreign market trading activity, including various industry and sector trading statistics within such markets. Technical trading models, through mathematical algorithms, attempt to identify when markets are likely to increase or decrease and identify appropriate entry and exit points. The primary risk of technical trading models is that historical trends and past performance cannot predict future trends and there is no assurance that the mathematical algorithms employed are designed properly, updated with new data, and can accurately predict future market, industry and sector performance.
Disclousure:
Investing involves risk, including the possible loss of principal and fluctuation of value. Past performance is no guarantee of future results.
This newsletter is not intended to be relied upon as forecast, research or investment advice, and is not a recommendation, offer or solicitation to buy or sell any securities or to adopt any investment strategy. The opinions expressed are as of the date noted and may change as subsequent conditions vary. The information and opinions contained in this letter are derived from proprietary and nonproprietary sources deemed by Waterloo Capital to be reliable. The letter may contain “forward-looking” information that is not purely historical in nature. Such information may include, among other things, projection, and forecasts. There is no guarantee that any forecast made will materialize. Reliance upon information in this letter is at sole discretion of the reader. Please consult with a Waterloo Capital financial advisor to ensure that any contemplated transaction in any securities or investment strategy mentioned in this newsletter aligns with your overall investment goals, objectives and tolerance for risk. Additional information about Waterloo Capital is available in its current disclosure documents, Form ADV, Form ADV Part 2A Brochure, and Client Relationship Summary report which are accessible online via the SEC’s investment Adviser Public Disclosure (IAPD) database at www.adviserinfo.sec.gov, using SEC # 133705. Waterloo Capital is neither an attorney nor an accountant, and no portion of this content should be interpreted as legal, accounting or tax advice.