
MARKET COMMENTARY
Last week, updates on the job market and inflation data signaled that the economy is moving toward a more favorable state. However, markets did not reflect this positivity, with weak performance across the board. This week, we will receive delayed housing market data for November and December of last year, along with Q4 GDP data and an updated Personal Consumption Expenditure Index. We will also hear earnings from Walmart, one company that has not experienced the market turmoil this year and is up 20% YTD. Walmart, an e-commerce mega cap, recently surpassed a $1 trillion market cap as it has grown in popularity among higher-income shoppers and taken an aggressive approach to implementing AI across its business.
Tomorrow will finally clear the backlog of housing data with new reports for housing starts and building permits. Over the past two years, demand across the housing market weakened, with housing completions typically exceeding new construction numbers. Based on economists’ reports, this trend of fewer housing starts is expected to continue through 2026, but will likely pick up in 2027. The sluggish growth is driven by demand that skyrocketed during the Covid pandemic, when the housing industry experienced a significant backlog due to supply chains disruptions and builders attempting to keep up with demand. Likewise, elevated mortgage rates combined with high construction costs will continue to stall growth for the upcoming year.
Momentum was a leading factor in markets last year, but has taken a back seat in recent weeks. Outside of emerging markets, momentum has been declining overall. This breakdown is likely the result of big tech leaders no longer leading the charge. This is not necessarily a negative development, as other market measures, such as the equal weight index, continue to improve, reflecting broader participation led by factors like value and dividends. In addition the VIX, a measure of equity market volatility, has broken above 20 reflecting the major intraday price swings we have seen recently.
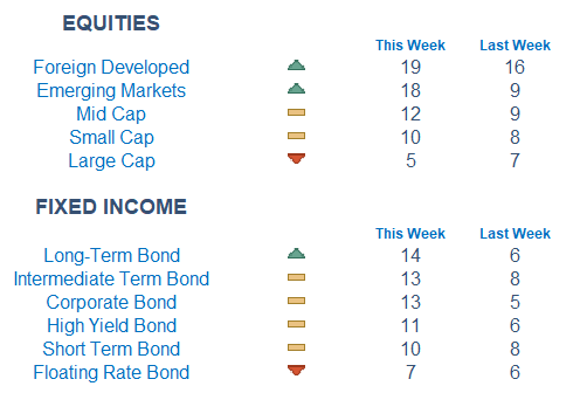
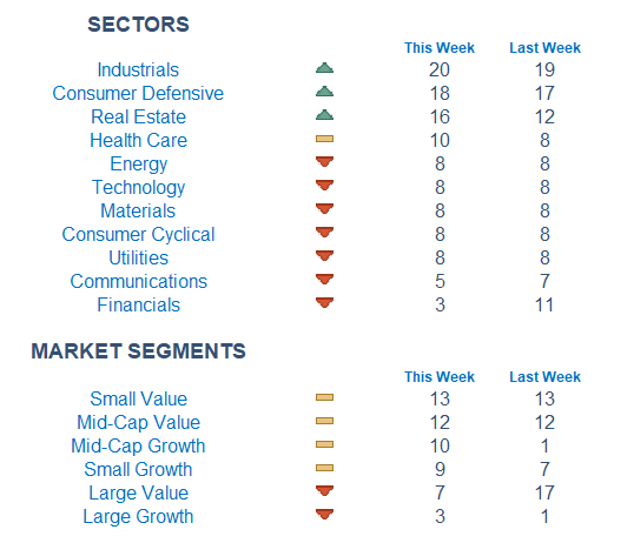
Our Newton model continues to favor foreign developed and emerging markets over the US. Fixed income is becoming more attractive following last week’s rally in US yields. Industrials remain at the top of our sector rankings, with consumer defensive and real estate not far behind. Real estate was a weak sector last year, but we are beginning to see signs of strength. Our focus remains on small-cap and value, which is our leading market segment this week, with mid-cap value and growth next.
Economic Releases This Week
Monday: None
Tuesday: None
Wednesday: Delayed Housing Data
Thursday: Initial Jobless Claims
Friday: GDP, PCE Index
Stories to Start the Week
IBM to triple entry-level US hiring with roles recast for AI era
Pentagon threatens to cut off Anthropic in AI safeguards dispute
Warner Bros weighs rejects revised Paramount bid, but remains open to a final offer
Rising memory chip prices are driving up consumer electronic costs
KPMG parnter fined for using artificial intelligence to cheat in AI training test

Our Newton model attempts to determine the highest probability of future price direction by using advanced algorithmic and high-order mathematical techniques onthe current market environment to identify trends in underlying security prices. The Newton model scores securities over multiple time periods on a scale of 0-20 with 0 being the worst and 20 being the best possible score.
Trend & level both matter. For example, a name that moves from an 18 to a 16 would signal a strong level yet slight exhaustion in the trend.
Technical trading models are mathematically driven based upon historical data and trends of domestic and foreign market trading activity, including various industry and sector trading statistics within such markets. Technical trading models, through mathematical algorithms, attempt to identify when markets are likely to increase or decrease and identify appropriate entry and exit points. The primary risk of technical trading models is that historical trends and past performance cannot predict future trends and there is no assurance that the mathematical algorithms employed are designed properly, updated with new data, and can accurately predict future market, industry and sector performance.
Disclousure:
Investing involves risk, including the possible loss of principal and fluctuation of value. Past performance is no guarantee of future results.
This newsletter is not intended to be relied upon as forecast, research or investment advice, and is not a recommendation, offer or solicitation to buy or sell any securities or to adopt any investment strategy. The opinions expressed are as of the date noted and may change as subsequent conditions vary. The information and opinions contained in this letter are derived from proprietary and nonproprietary sources deemed by Waterloo Capital to be reliable. The letter may contain “forward-looking” information that is not purely historical in nature. Such information may include, among other things, projection, and forecasts. There is no guarantee that any forecast made will materialize. Reliance upon information in this letter is at sole discretion of the reader. Please consult with a Waterloo Capital financial advisor to ensure that any contemplated transaction in any securities or investment strategy mentioned in this newsletter aligns with your overall investment goals, objectives and tolerance for risk. Additional information about Waterloo Capital is available in its current disclosure documents, Form ADV, Form ADV Part 2A Brochure, and Client Relationship Summary report which are accessible online via the SEC’s investment Adviser Public Disclosure (IAPD) database at www.adviserinfo.sec.gov, using SEC # 133705. Waterloo Capital is neither an attorney nor an accountant, and no portion of this content should be interpreted as legal, accounting or tax advice.