
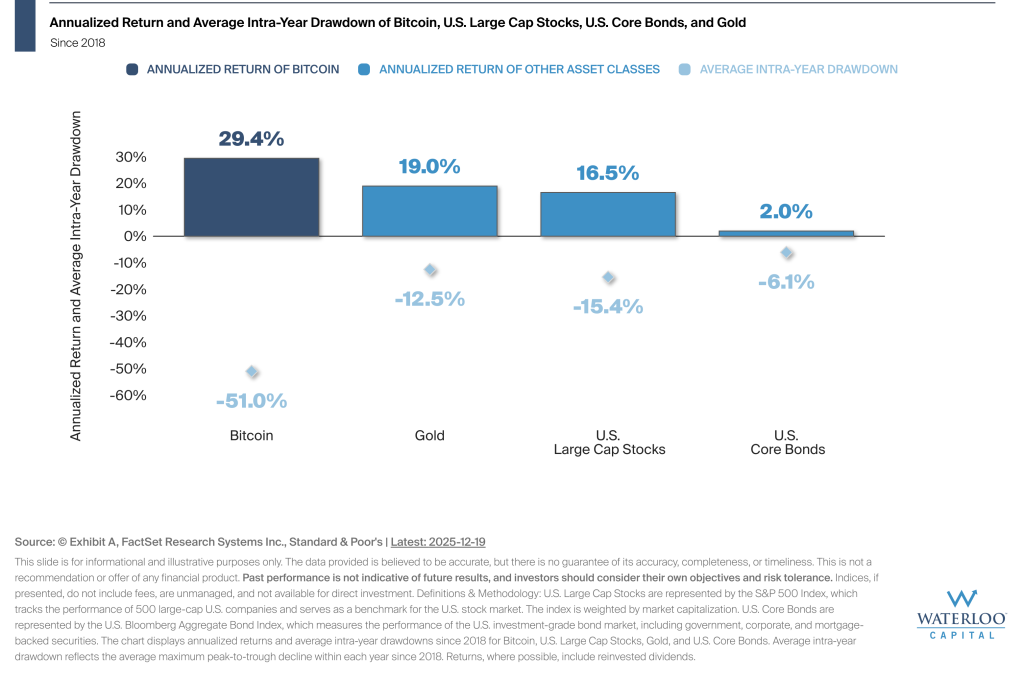
This chart puts Bitcoin’s performance since 2018 into context by pairing strong returns with the deep drawdowns that have come along the way.
While Bitcoin has led U.S. Large Cap Stocks, U.S. Core Bonds, and Gold since 2018, it’s also faced average intra-year declines of more than 50%. The question for investors isn’t just about returns – It’s whether they can stay invested through that level of volatility.
This comparison reinforces the importance of aligning investments with an investor’s risk tolerance, time horizon, and ability to withstand sharp market moves.