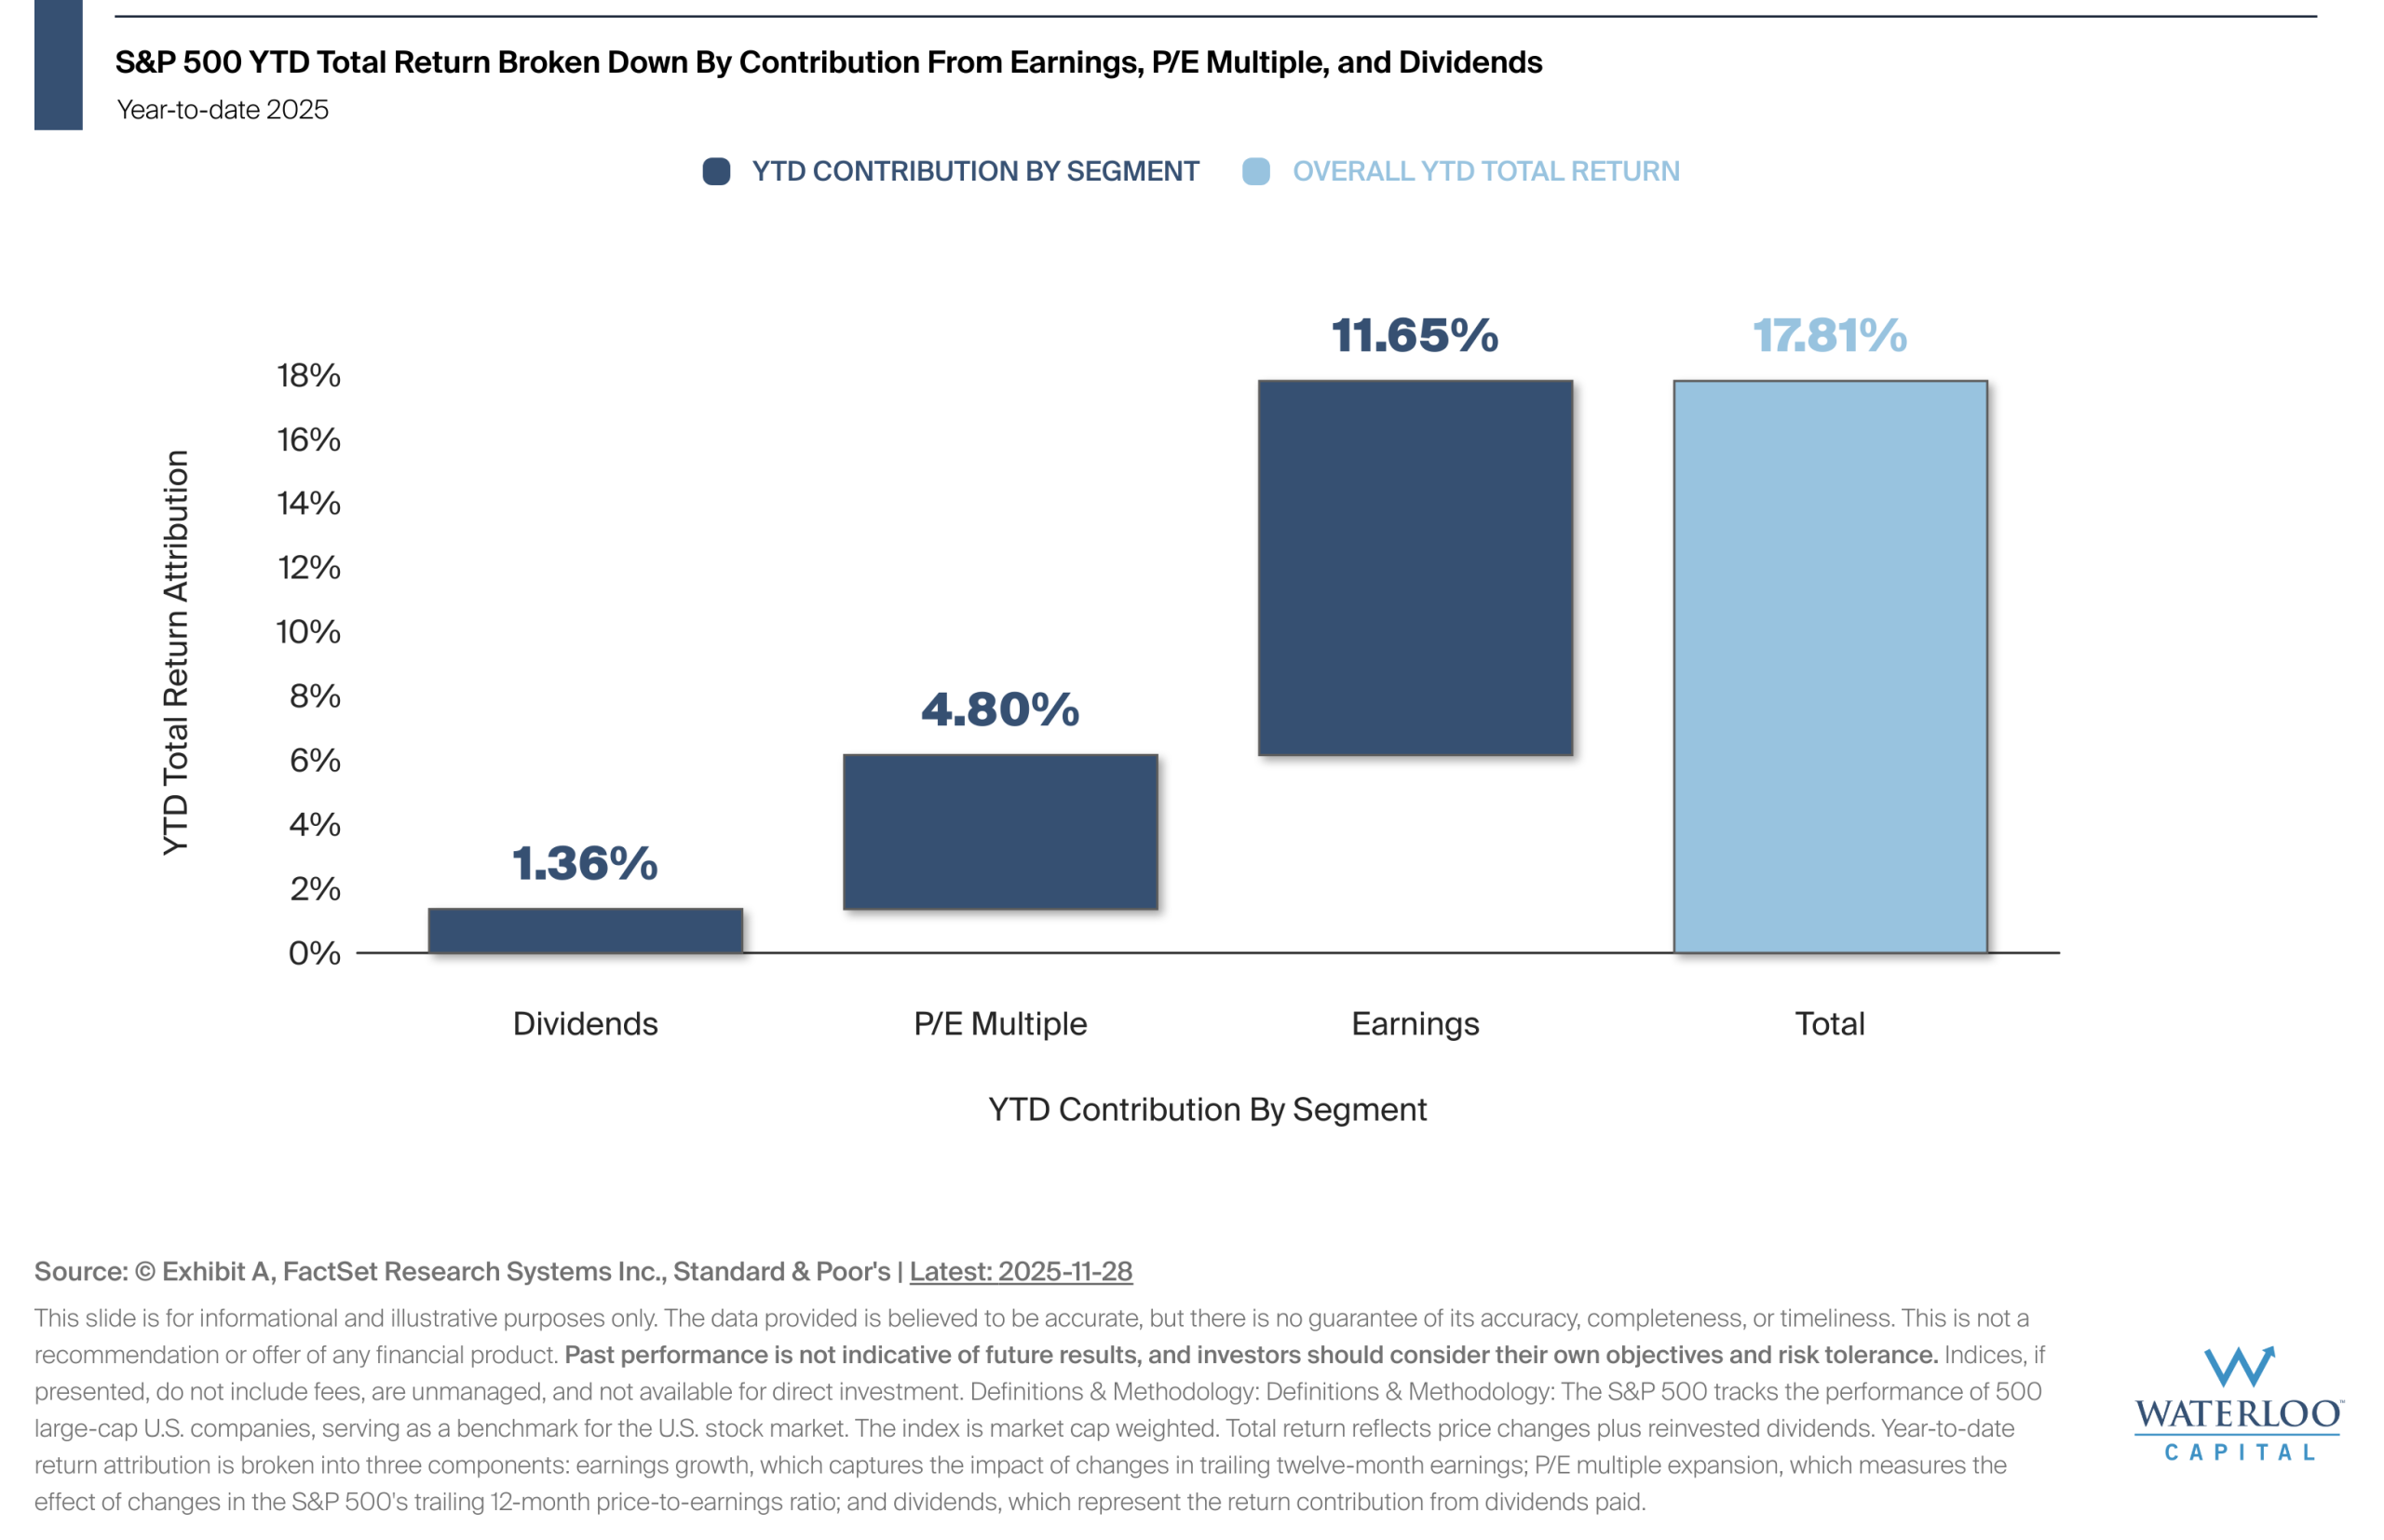

The chart shows the S&P 500’s total return year-to-date broken down into the contribution from three segments: earnings growth, P/E multiple, and dividends.
Year-to-date, the S&P 500’s total return is 17.81%.
Breaking down returns this way helps show whether market gains are being supported by underlying fundamentals or shifts in valuation.