
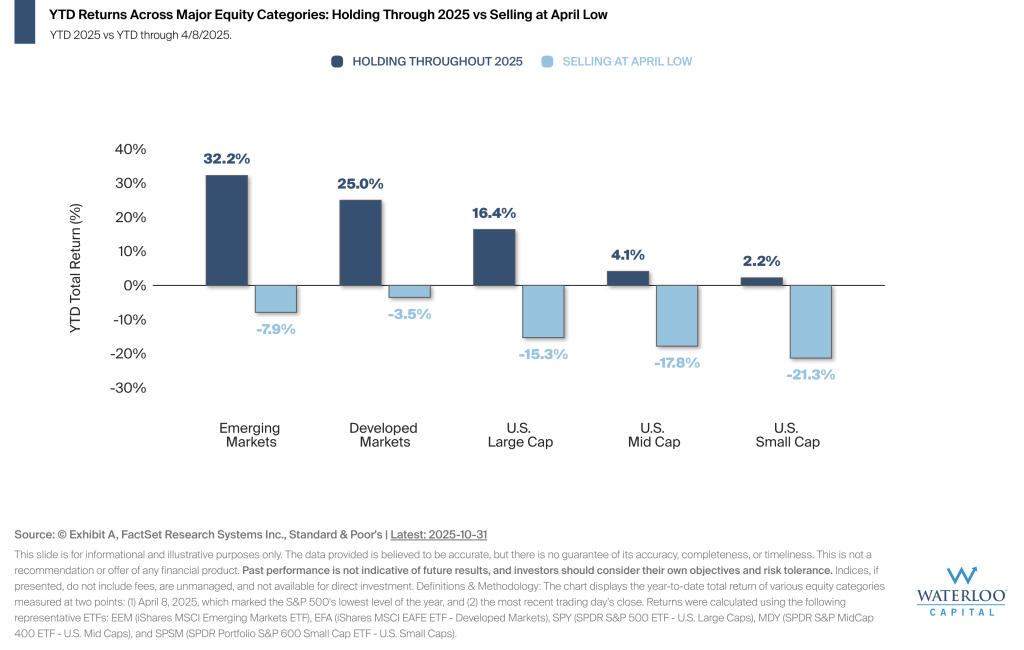
The chart compares year-to-date returns across major equity categories for two scenarios: investors who held throughout 2025 versus those who sold during April’s market panic.
Investors who stayed the course have been rewarded in 2025, with all categories of equities generating strong returns relative to their drawdowns in mid April.
The data underscores the stark difference in investment outcomes this year for those who sold at the April lows vs those who have stayed invested.