
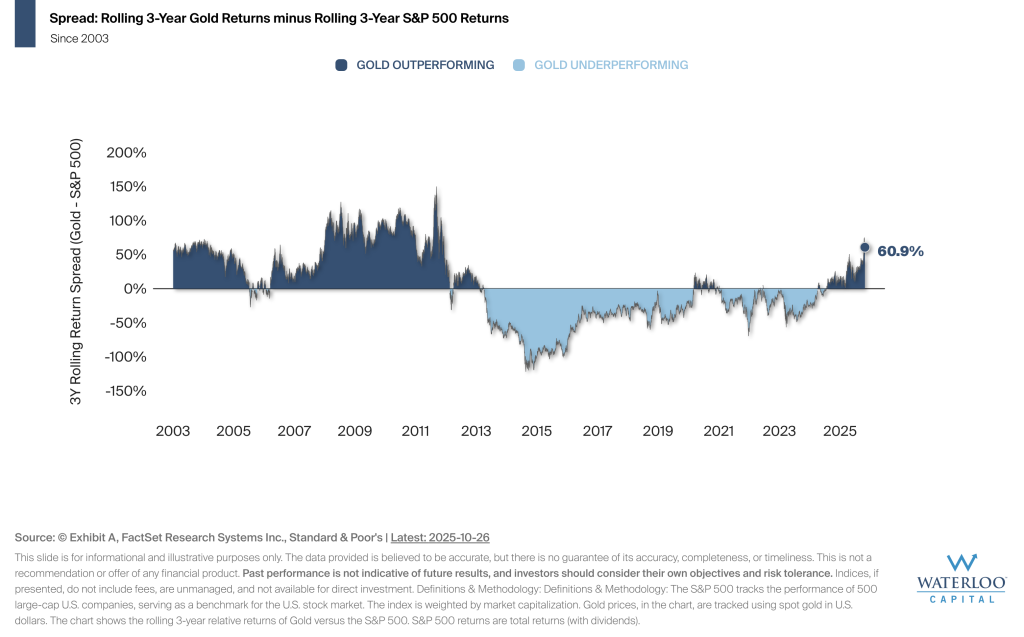
The chart illustrates the rolling 3-year performance difference between gold and the S&P 500, showing how leadership between the two assets has shifted across different market cycles since 2003.
As of October 23, 2025, the rolling 3-year performance spread shows gold outperforming the S&P 500 by 64.7%.
The chart highlights that relative performance between gold and equities has historically rotated over time. Recognizing these shifts may help investors maintain diversified portfolios and better understand how different assets respond to evolving economic environments.