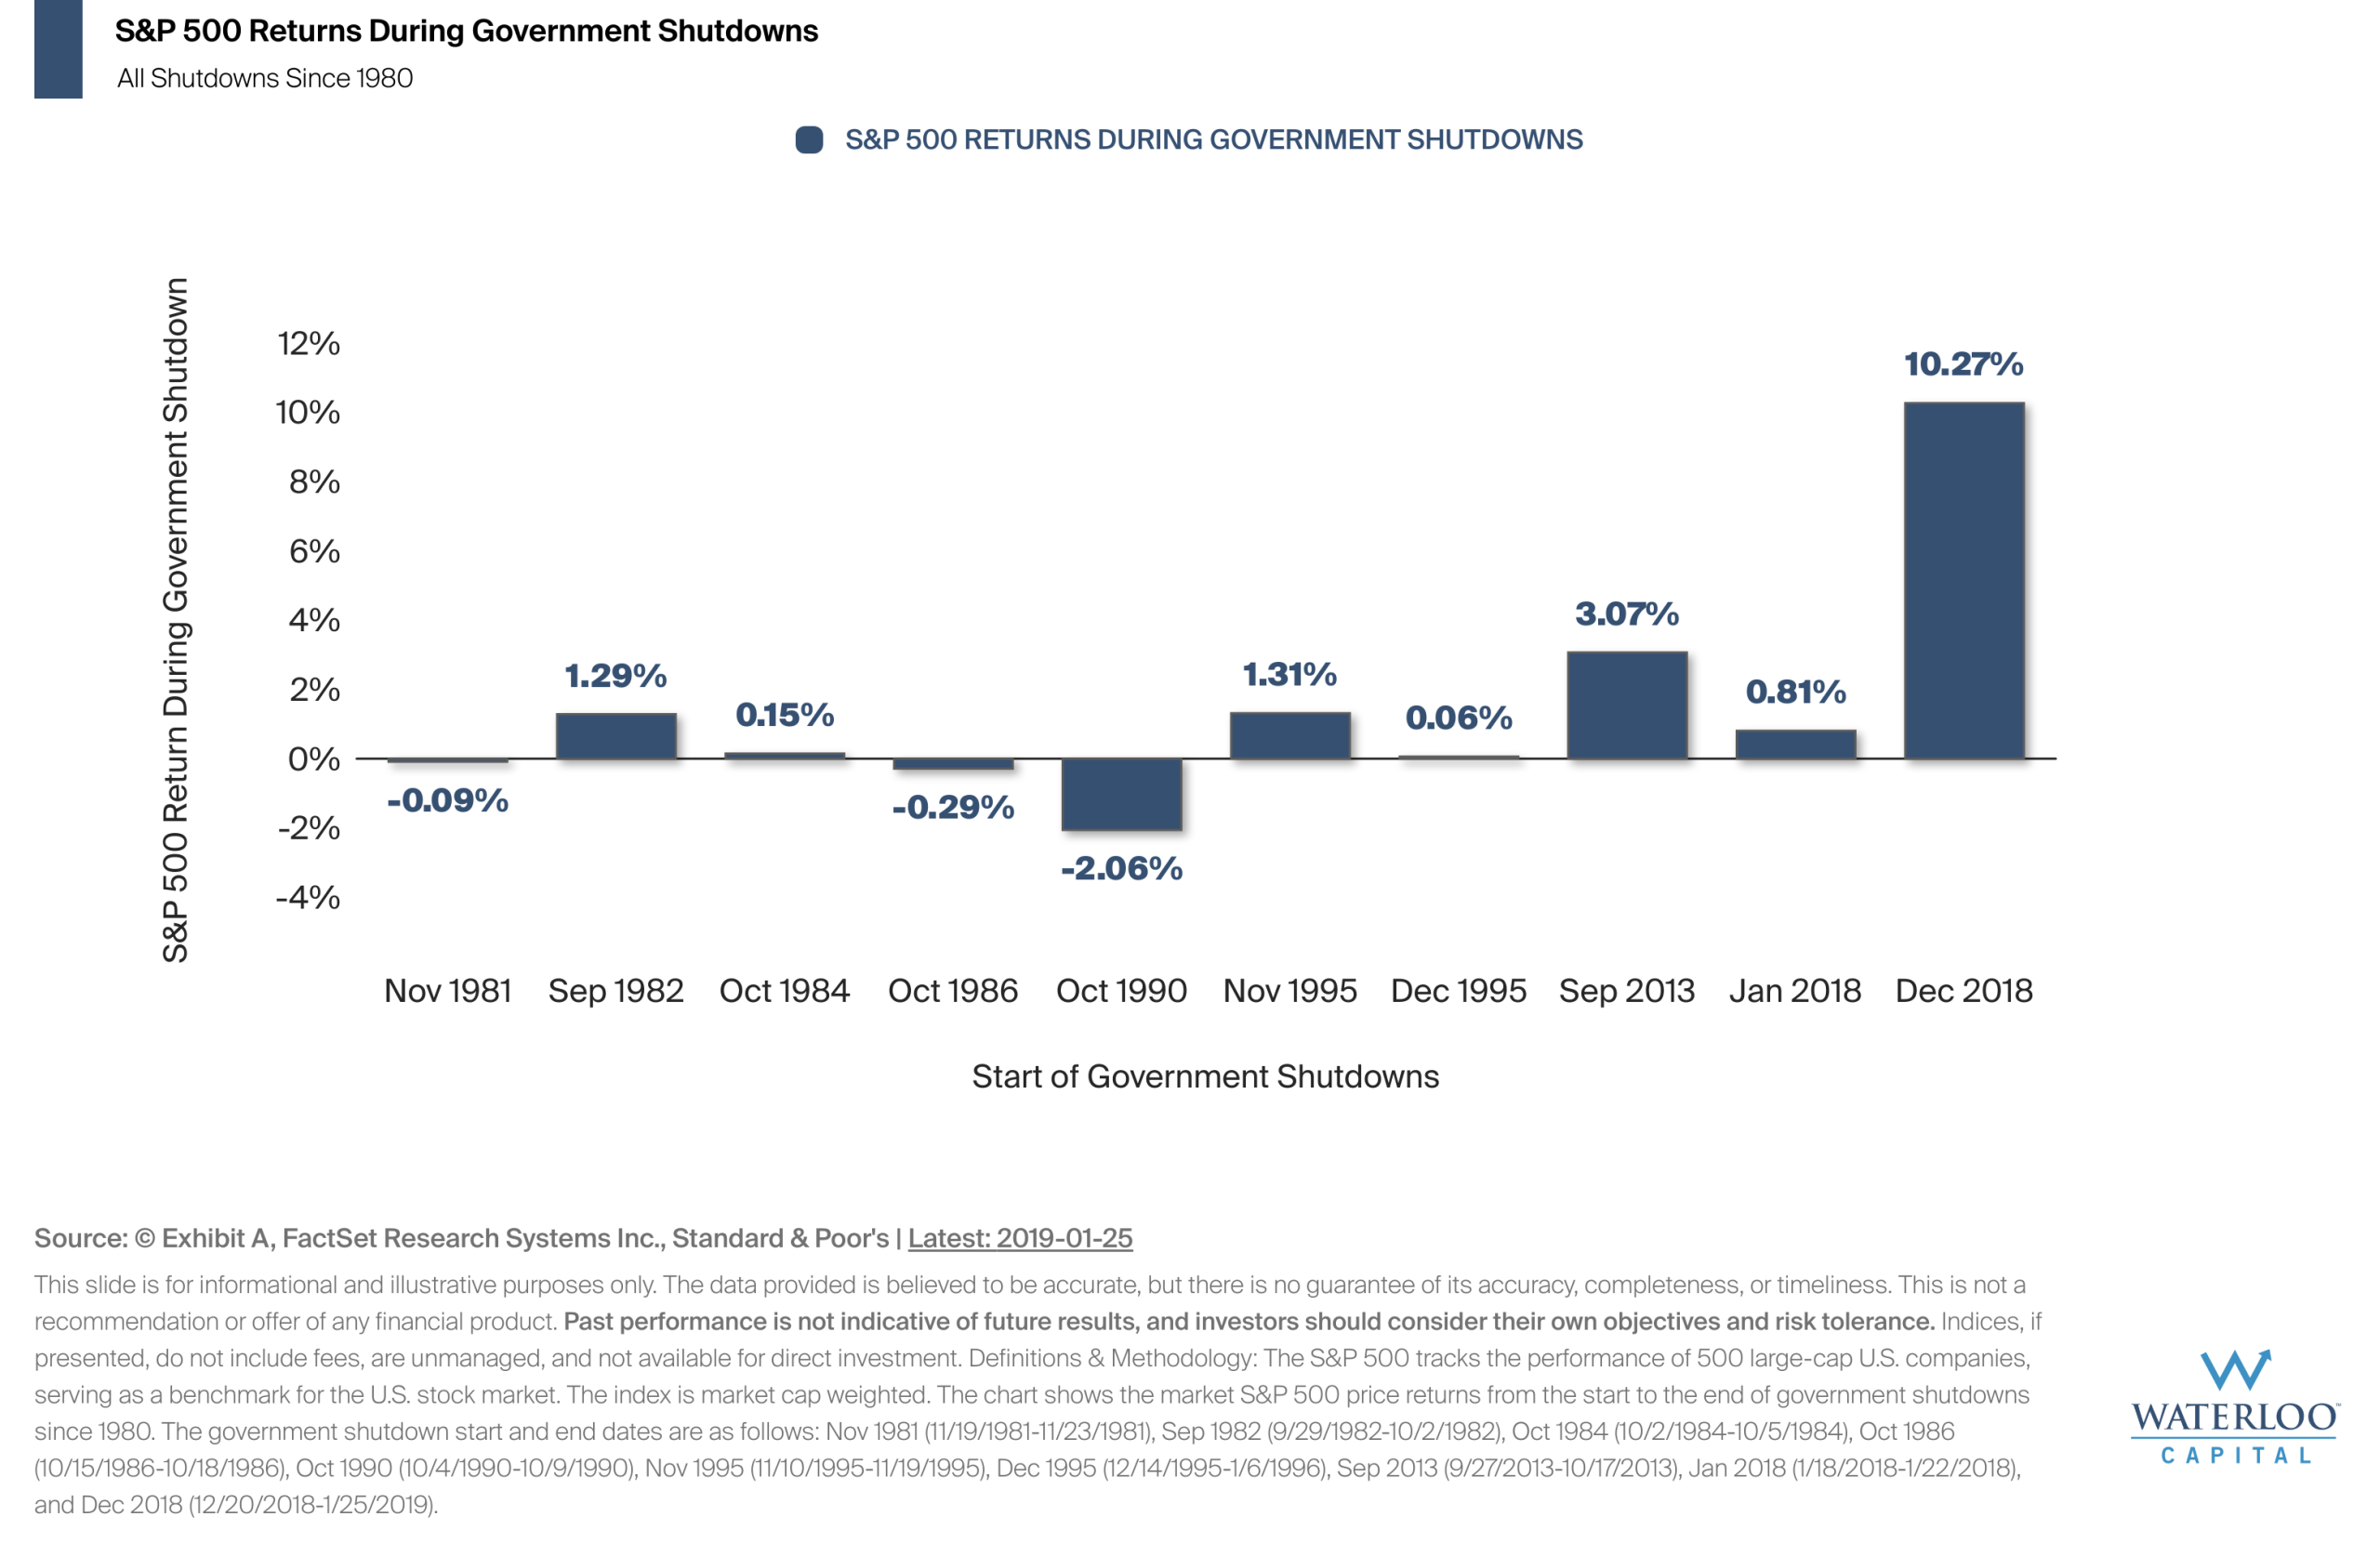

This chart tracks how the S&P 500 performed during past U.S. government shutdowns. While shutdowns often dominate the headlines, market returns during these periods have varied widely.
In 7 of the past 10 shutdowns since 1980, the S&P 500 actually generated a positive return, showing that markets have often looked past the noise.
The data highlights that short-term political events have not consistently dictated market direction. For investors, it’s a reminder that tuning out the noise has historically been more effective than reacting to it.