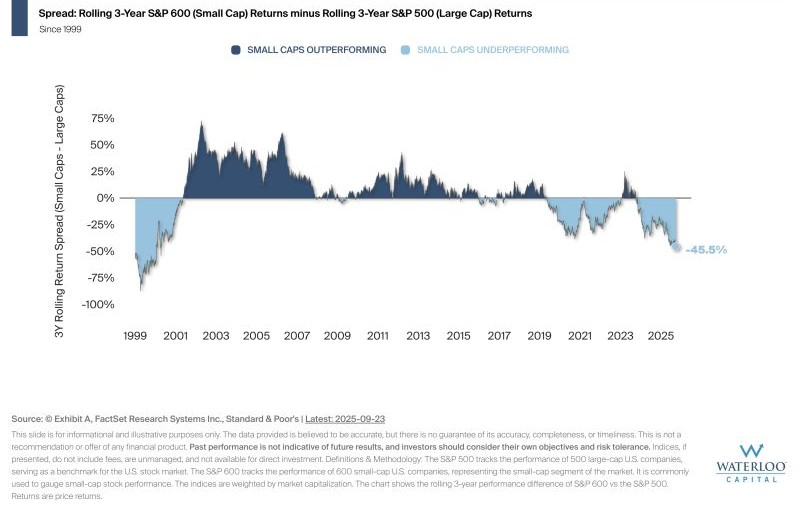
The chart illustrates the rolling 3-year performance difference between small-cap stocks (S&P 600) and large-cap stocks (S&P 500), highlighting how their relative performance has shifted over time.
A Look at the Recent Data: As of September 23, 2025, the 3-year rolling performance spread between small-cap and large-cap stocks is -45.5%, with small caps underperforming large caps over this period.
Investment Implications: The chart shows that relative performance between small and large-cap stocks has rotated across market cycles. Recognizing these historical patterns may be a useful consideration when constructing a diversified portfolio.