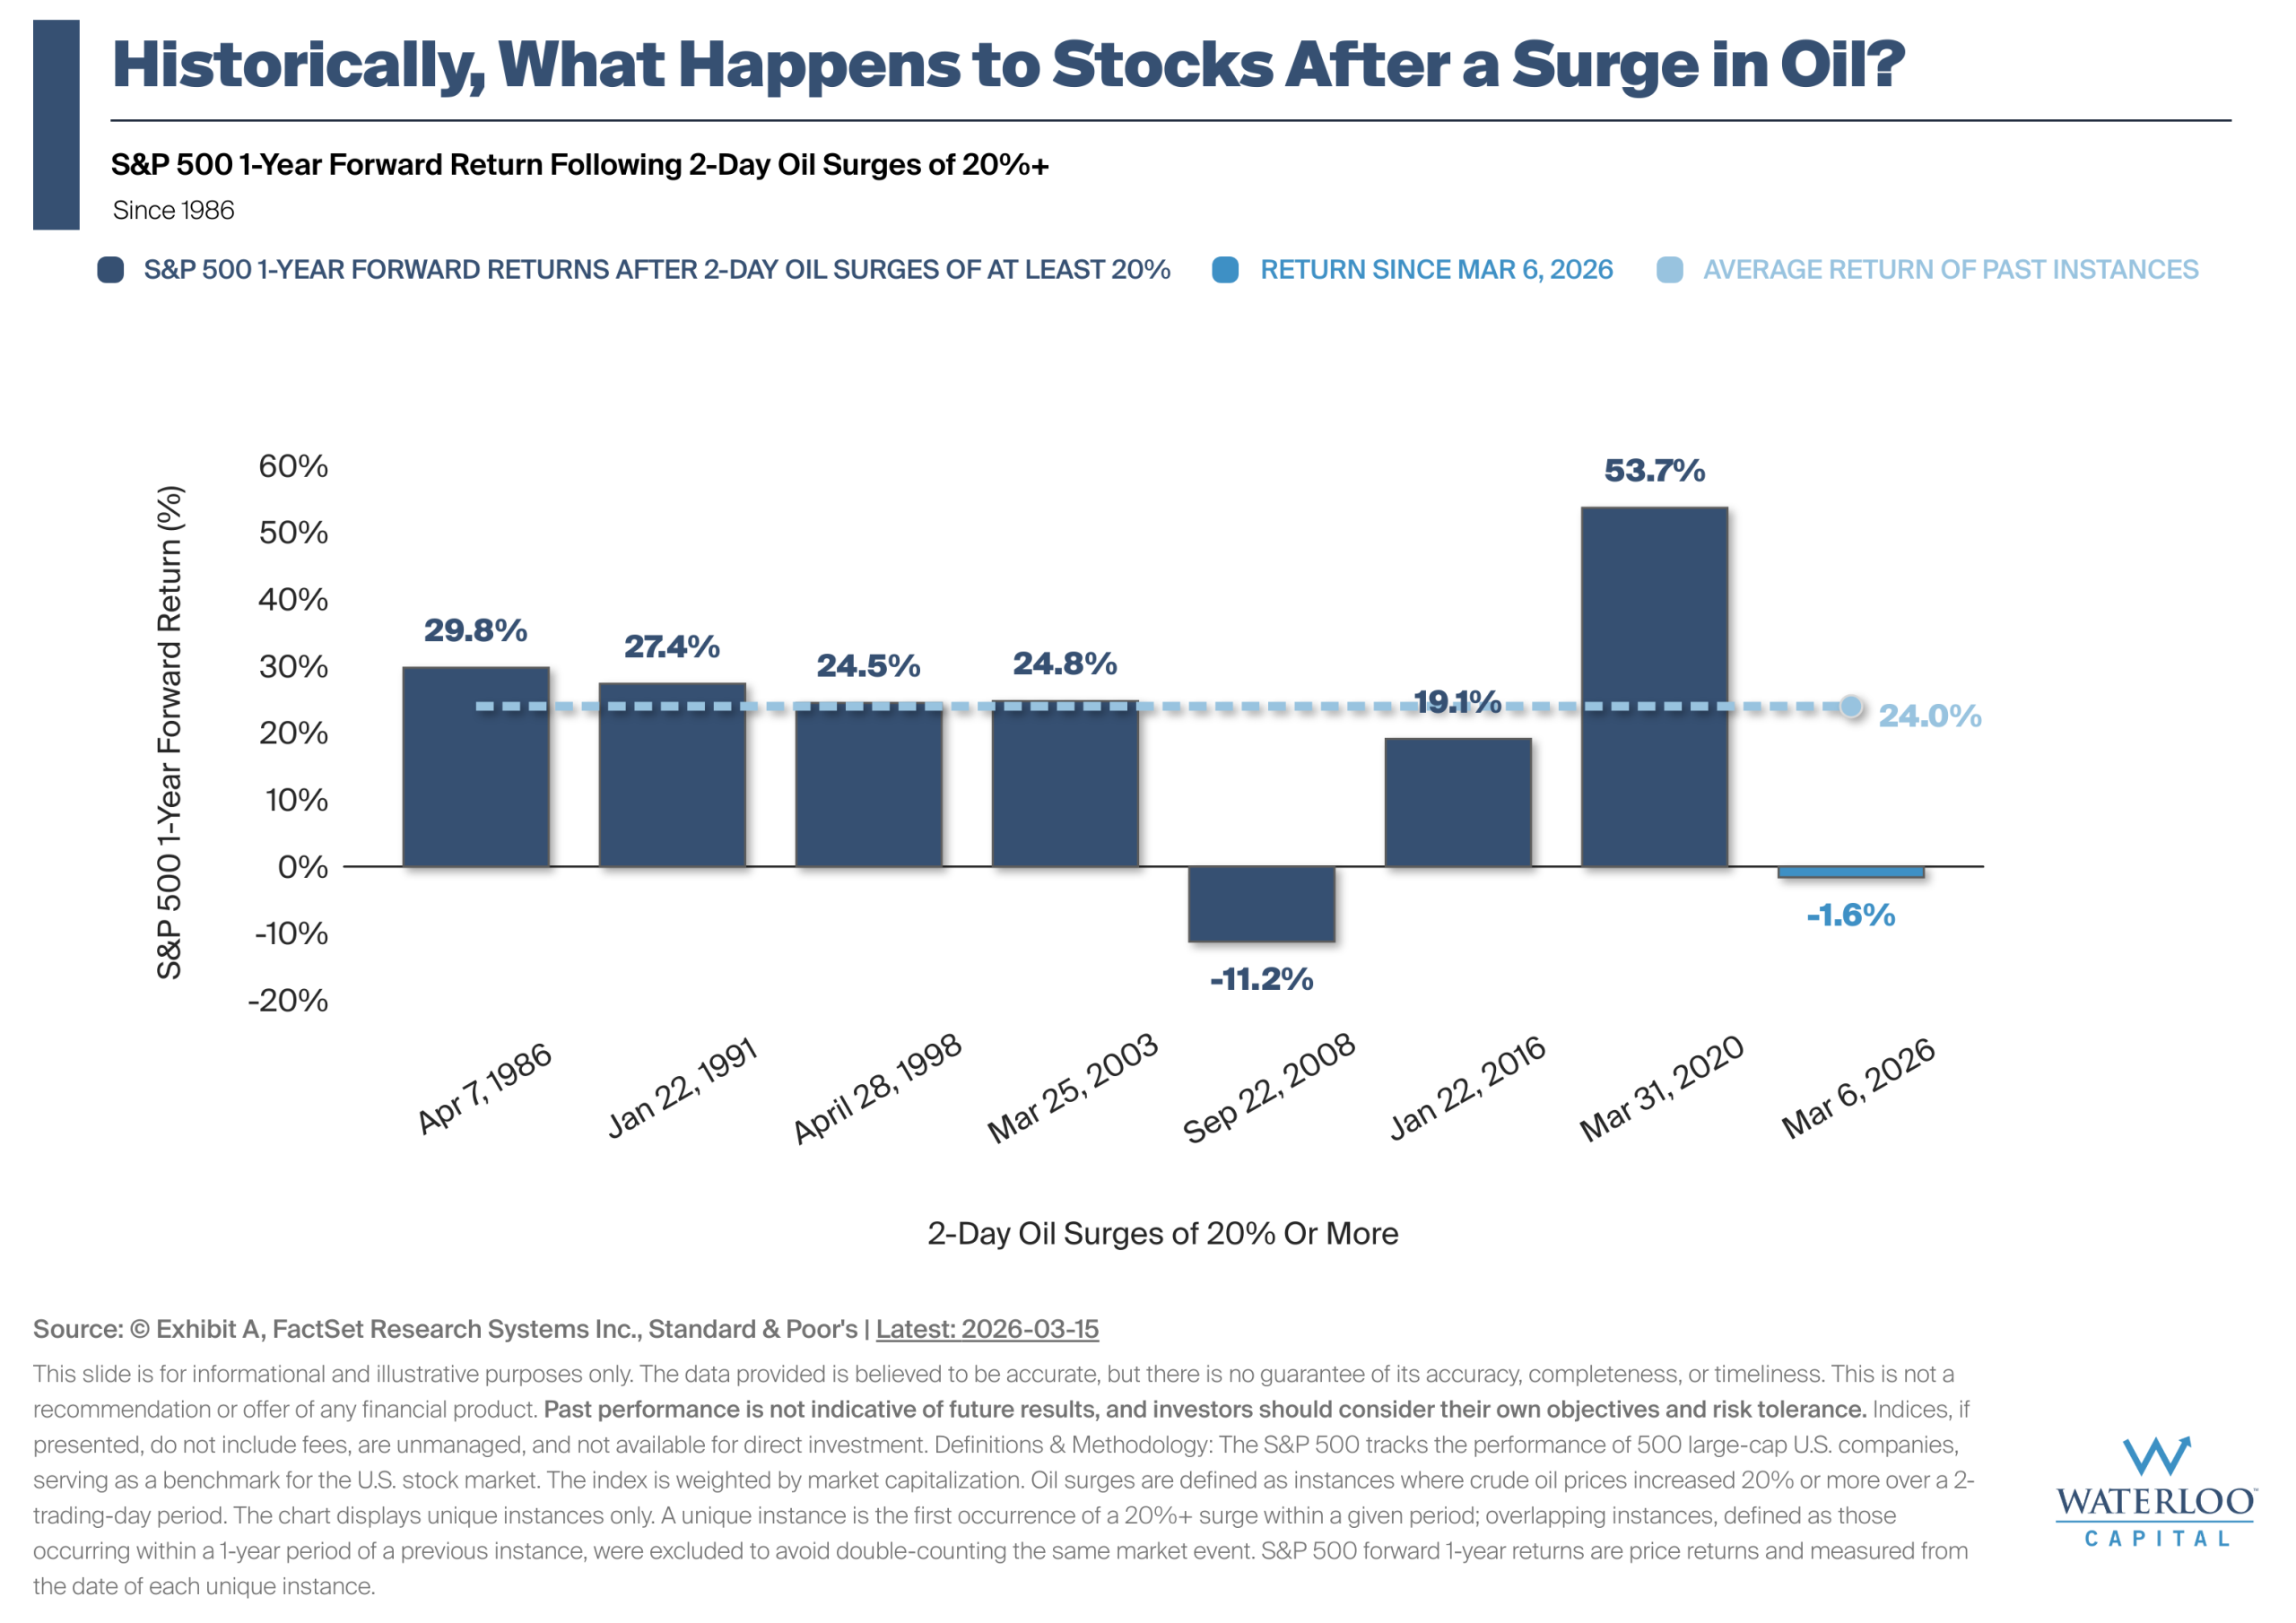
Chart Of the Week – What Happens to Stocks After a Surge in Oil?
The chart illustrates how the S&P 500 has historically performed over the following year after 2-day oil[…]

Economic Outlook 2026: Key Risks & Opportunities
Get the economic outlook 2026 with insights on global growth, key risks, and opportunities to help you[…]
Let’s Connect
©2025. Advisory services offered through Waterloo Capital, LP, An SEC Registered Investment Advisor.