
Off the backs of a Fed meeting and soft jobs report, equities headed for their best 3-day rally of the year.

This Week on Wall Street - Week of May 6th
Market Commentary
Off the backs of a Fed meeting and soft jobs report, equities headed for their best 3-day rally of the year. A positive earnings season has also been a catalyst. The 10-year Treasury yield has decreased about 10 basis points to 4.5%. Many traders will watch the auctions this week of a combined $67 billion of 10 and 30-year securities to see how much demand there is for longer-dated fixed income.
It is a lighter week in economic data releases however, we are getting a large number of Fed speakers. We will be observing to see what kind of language is used around potential rate cuts into year-end and the recent soft labor reports. As the year has progressed, markets have priced out many cuts for 2024. Since the Fed meeting Wednesday, that trend has reversed as traders have cautiously upped bets for more easing this year.
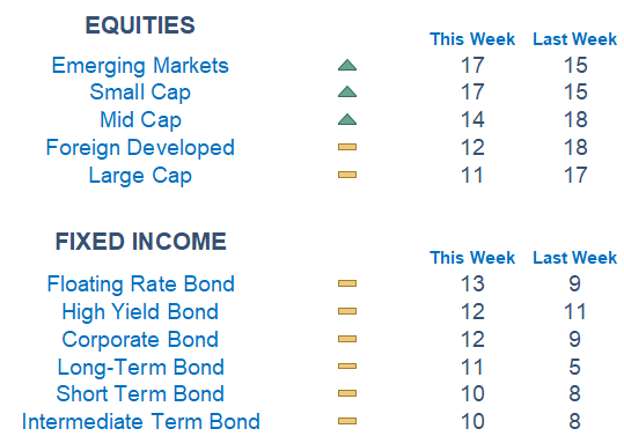
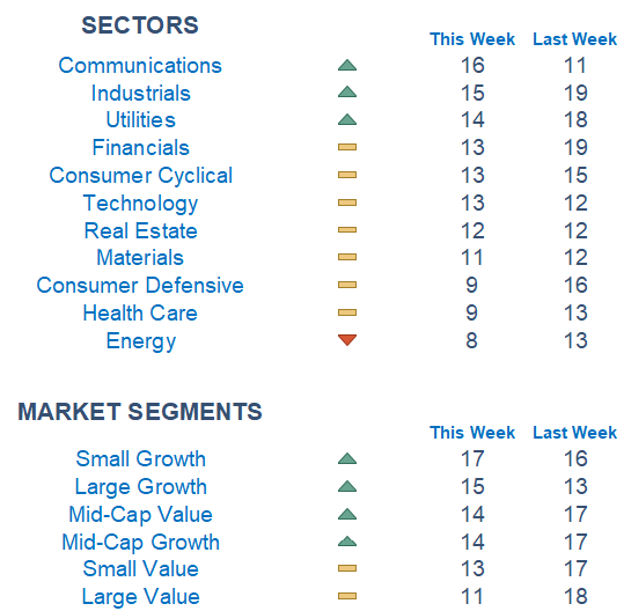
The S&P 500 has had a great start to May, up over 2% after taking a pause in April. We are back to 5,150 level, close to the all-time highs of 5,260. This rally has coincided with better breadth in the market which the bulls hope is sustained. Our Newton models show increased strength out of Emerging Markets on the back of stronger Chinese markets. China makes up nearly 30% of the index. Energy is the biggest laggard. Notably, oil has had a muted month while Hamas accepted a cease-fire proposal for Gaza. Communications is on top followed by Industrials and Utilities.
Economic Releases This Week
Monday: None
Tuesday: Employment Cost Index, S&P Case Shiller Home Price Index, Consumer Confidence
Wednesday: ADP Employment, ISM Manufacturing, Job Openings, Fed Interest Rate Decision
Thursday: Initial Jobless Claims, US Trade Deficit, US Productivity
Friday: ISM Services, Jobs Report: Payrolls, Unemployment Rate, Hourly Wages
Stories to Start the Week
After years of delays and stumbles, Boeing is finally poised to launch astronauts to the International Space Station for NASA.
Buffett reassured investors that a plan was in place for his succession, revealing that Greg Abel would be making the call on investing decisions.
Chinese President Xi Jinping kicked off a three-country trip to Europe on Sunday.
A free Madonna concert drew a crowd of 1.6 million people to Brazil's Copacabana beach.

What is Newton?
Our Newton model attempts to determine the highest probability of future price direction by using advanced algorithmic and high-order mathematical techniques on the current market environment to identify trends in underlying security prices. The Newton model scores securities over multiple time periods on a scale of 0-20 with 0 being the worst and 20 being the best possible score. Trend & level both matter.
Technical trading models are mathematically driven based upon historical data and trends of domestic and foreign market trading activity, including various industry and sector trading statistics within such markets. Technical trading models, through mathematical algorithms, attempt to identify when markets are likely to increase or decrease and identify appropriate entry and exit points. The primary risk of technical trading models is that historical trends and past performance cannot predict future trends and there is no assurance that the mathematical algorithms employed are designed properly, updated with new data, and can accurately predict future market, industry and sector performance.