
Equities continued to stage a small rebound to end the month of April after pulling back on bets that the Fed would keep interest rates higher for longer.

This Week on Wall Street - Week of April 30th
Market Commentary
Equities continued to stage a small rebound to end the month of April after pulling back on bets that the Fed would keep interest rates higher for longer. Stronger than expected earnings is one reason as early results suggest over 80% of companies are beating expectations. Earnings for the first quarter are now on track to increase 4.7% YoY compared with the 3.8% estimate.
The S&P 500 is slightly above the 5,100 level while the 10 Year Treasury Yield remains above 4.6%. We have key economic data and events this week, the first being Jerome Powell & Co. The speech the Chairman gives will ultimately be more important than the decision, one that will almost certainly keep interest rates unchanged. Investors will be looking for more insight on when the Fed expects to cut rates, their views on the recent stickiness in inflation, and first quarter GDP miss.
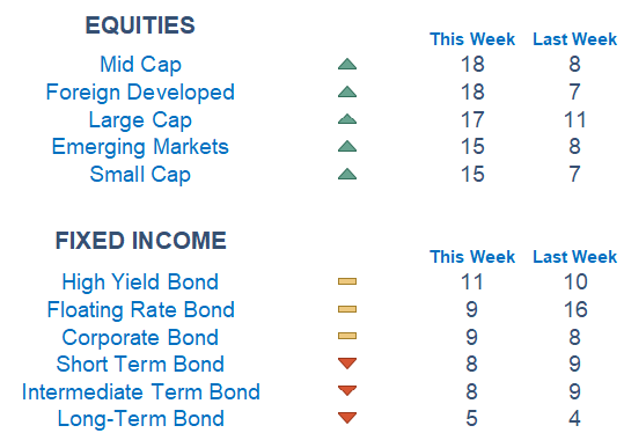
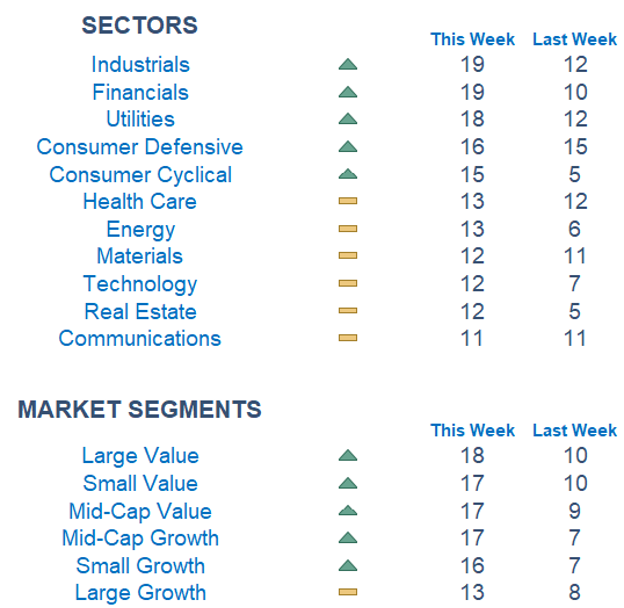
We are seeing fewer negative readings across the board as the rate of change in scores is positive. This is a sign of a bounce off of oversold levels and we will monitor closely if it is the start of a new trend or just a blip. Large Value sits on top followed closely by Mid Caps and Foreign Developed. Bonds are still weak. Financials, Industrials, and Utilities are on top while Communications, Real Estate, and Materials are at the bottom.
Economic Releases This Week
Monday: None
Tuesday: Employment Cost Index, S&P Case Shiller Home Price Index, Consumer Confidence
Wednesday: ADP Employment, ISM Manufacturing, Job Openings, Fed Interest Rate Decision
Thursday: Initial Jobless Claims, US Trade Deficit, US Productivity
Friday: ISM Services, Jobs Report: Payrolls, Unemployment Rate, Hourly Wages
Stories to Start the Week
In China, Elon Musk scores wins on the path to self-driving cars.
Paramount CEO Bob Bakish is stepping down.
The NFL draft has a new attendance record after more than 775,000 fans flooded downtown Detroit for the three-day event.

What is Newton?
Our Newton model attempts to determine the highest probability of future price direction by using advanced algorithmic and high-order mathematical techniques on the current market environment to identify trends in underlying security prices. The Newton model scores securities over multiple time periods on a scale of 0-20 with 0 being the worst and 20 being the best possible score. Trend & level both matter.
Technical trading models are mathematically driven based upon historical data and trends of domestic and foreign market trading activity, including various industry and sector trading statistics within such markets. Technical trading models, through mathematical algorithms, attempt to identify when markets are likely to increase or decrease and identify appropriate entry and exit points. The primary risk of technical trading models is that historical trends and past performance cannot predict future trends and there is no assurance that the mathematical algorithms employed are designed properly, updated with new data, and can accurately predict future market, industry and sector performance.